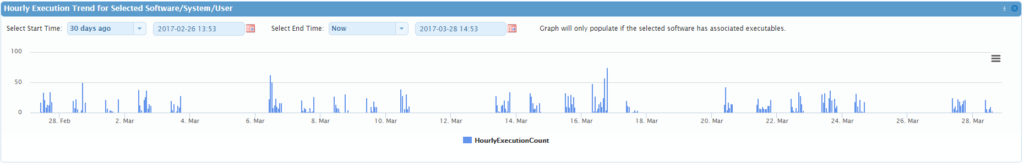
Monitoring software performance plays a vital role in the observation of software assets. Software performance monitoring is driven by the need to understand how well applications are working in the environment, and where resources should be directed to improve the performance. We’ve created a Software Asset Analytics kit to make it easy for IT admins to understand and observe software performance in order to help maintain a successful environment. There is a section dedicated to monitoring software performance involving key metrics like resource consumption details (CPU, memory, IOPS, network bandwidth) as well as number and frequency of app faults and hangs. Having a full understanding can help answer daily questions like “why does my application keep crashing?” and “what application takes the longest to load?”. Gaining insight in software performance can lead to a successful environment.
The observation of software performance is a vital component to understanding the source of impact to the user experience, preventing that impact from getting worse, and understanding how well an environment is working together. It is a category often noticed first by an end user, which makes it very important since it has a direct impact on productivity and user experience. Our performance dashboards make observing aggregated data easy for IT by highlighting trends and details in resource consumption metrics as well as app performance metrics like load time and faults. To identify issues or track performance, IT can choose between the provided dashboards that provide both summary views and detailed, deep-dive looks at application data. To prevent app issues from spreading through the environment, IT can easily see where trends may start to go down, implying the end user environment may become poor. After big changes to an environment, such as a new version of Outlook, IT can easily monitor how well the environment is performing based on the observation of resource consumption, user experience, app faults, and similar metrics.
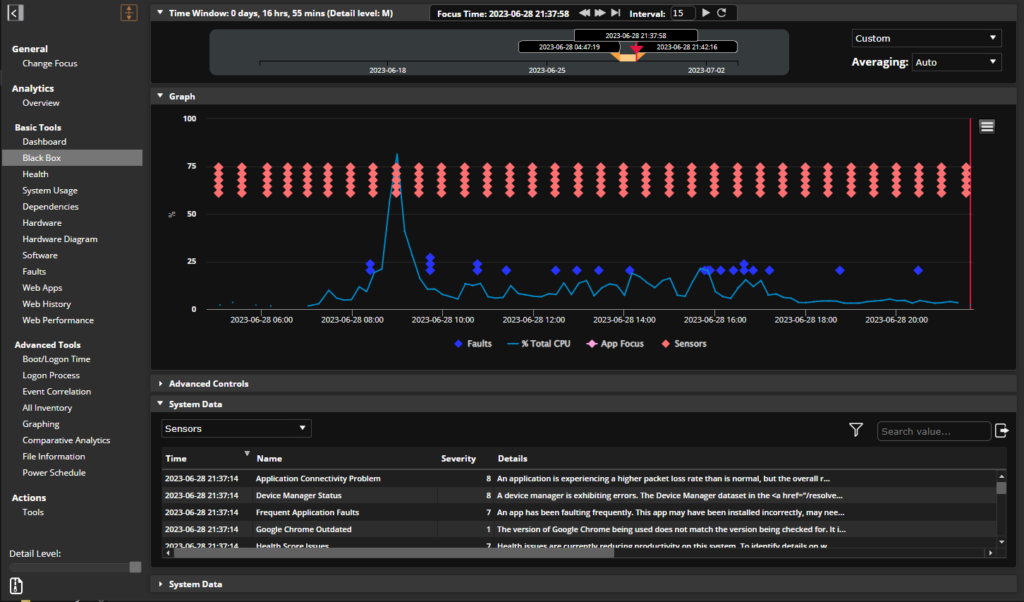
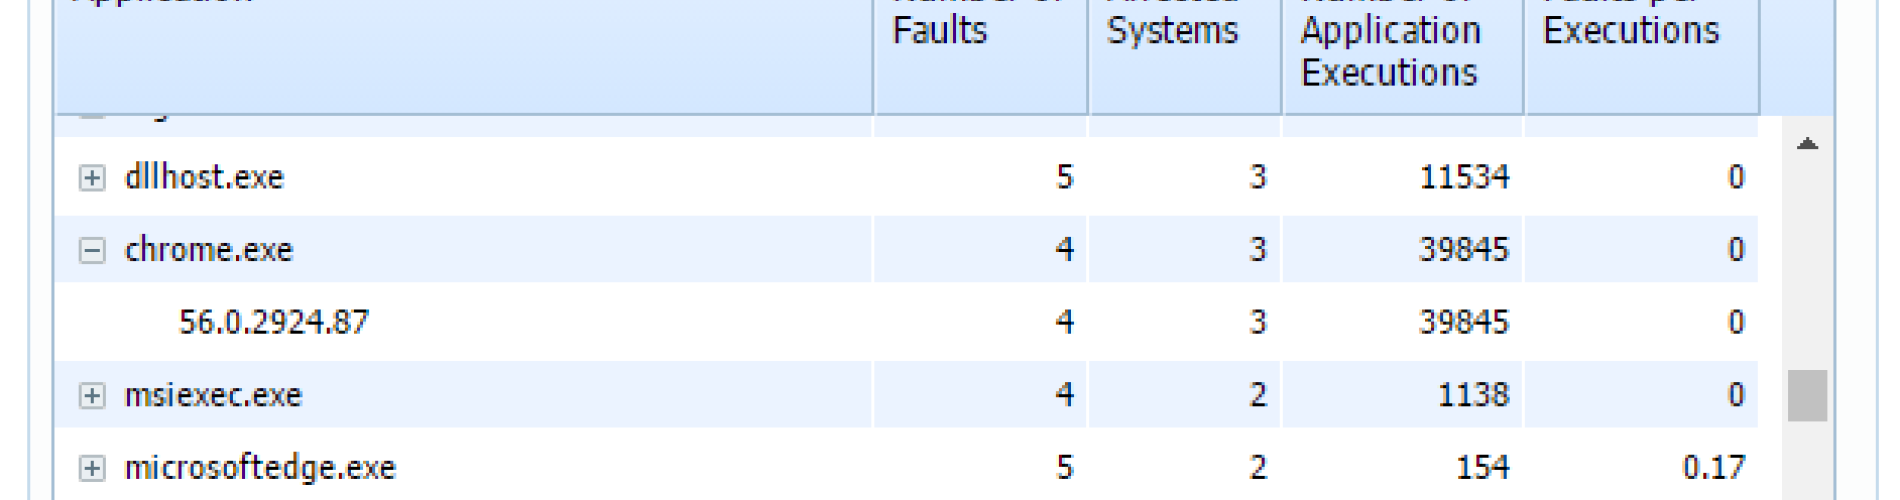
A simple use case can help illustrate the value in app performance data. Let’s say an IT administrator notices that an application consistently crashes, but isn’t sure of the root cause. The Application Faults and Apps Running at Time of Fault dashboards in the kit provide details on crashing applications. They start with the more general dashboard, Application Faults, and search for the application in question in the chart displayed below.
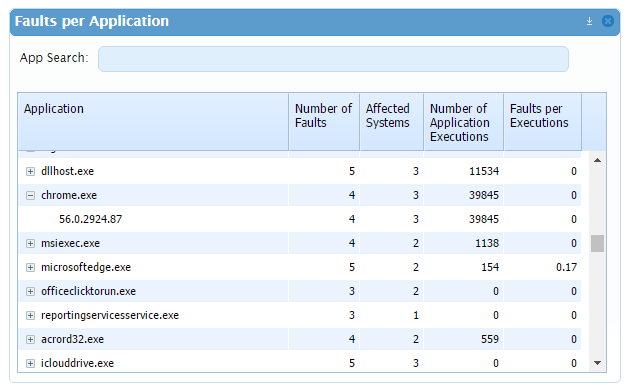
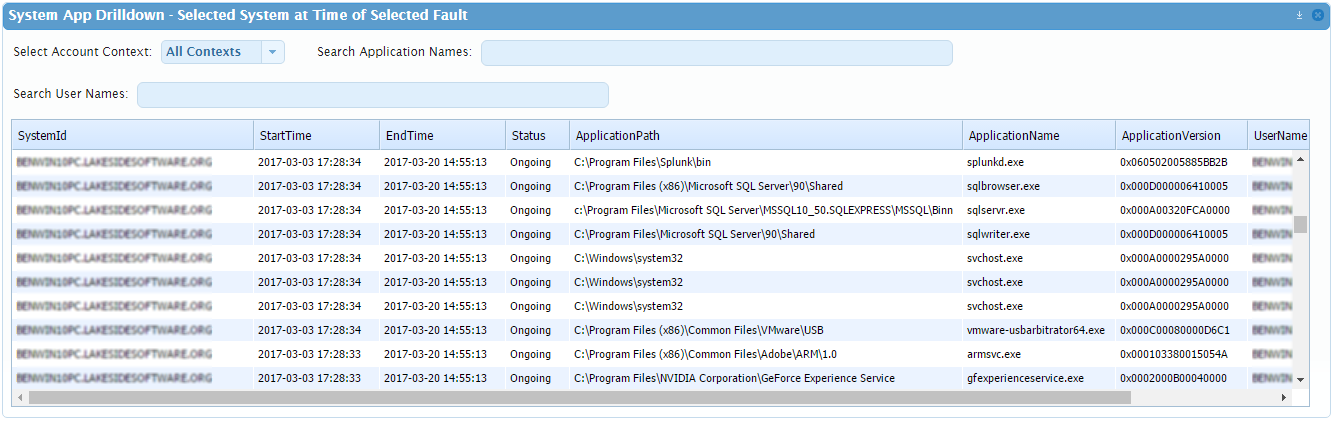
They now can take note of details such as how many systems this application crash is affecting and the number of faults, providing an idea of whether the issue is isolated or widespread. They venture further into the Apps Running at Time of Fault dashboard and again search for the crashing application. This dashboard highlights details like what kind of fault occurred, faulting module, time of fault, and more. They also have the ability to see their system at the time of fault to understand what other apps were running as well as system stats like resource consumption. This added context provides a much more complete picture of what was happening around the time of app crash.
As they proceed further down the dashboard, they can now observe trends on CPU, memory, IOPs, or disk space to help determine the reason for the application fault as displayed below.
This finalizes our categories covering our newly released Software Asset Analytics Kit. For more details on this topic, read our upcoming white paper, Software Asset Analytics!


Subscribe to the Lakeside Newsletter
Receive platform tips, release updates, news and more