SysTrack + PowerBI
Uncover the full potential of your data


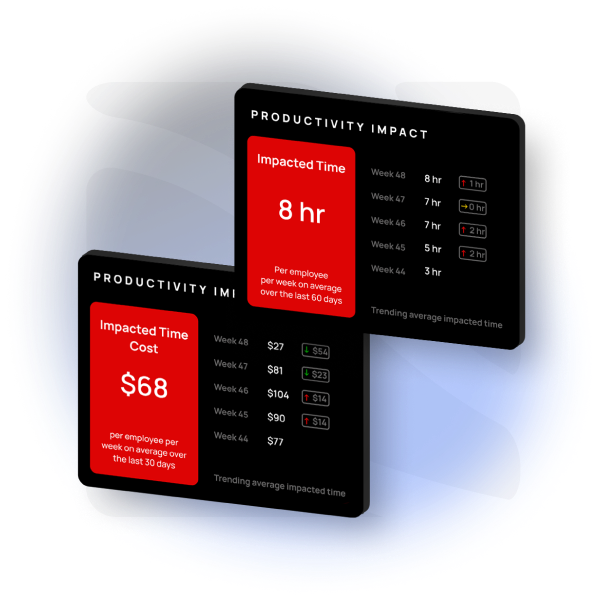
Bring data to life
SysTrack captures 10,000 data points every 15 seconds from more than 1000 sensors investigating the endpoint. Pull data into Microsoft BI to combine with other business data to analyze, visualize, and report on every facet of your IT estate. Get executive insights automatically using SysTrack templates that shrink the learning curve for people who are not Power BI experts.
Streamline your ITSM and reduce MTTR
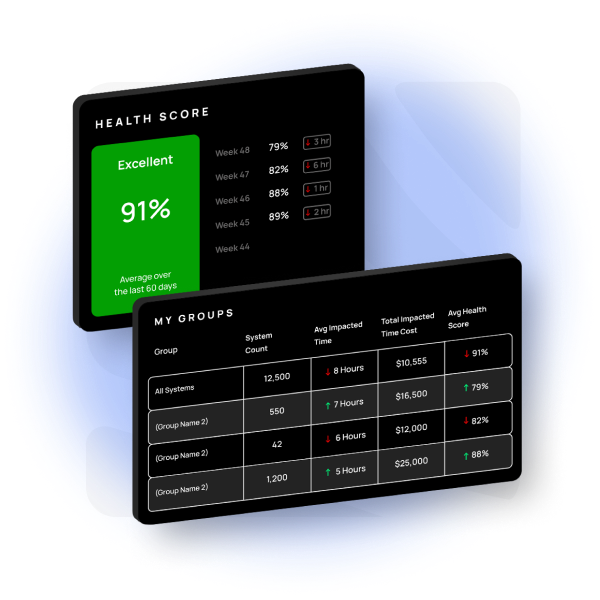
Create dashboards, charts, graphs and tables
Gain actionable insights quickly by creating interactive charts, graphs, tables, and dashboards so you can explore data from various angles to identify trends and anomalies. Enhance data-driven decision-making and articulate insights to stakeholders across the organization, regardless of their technical background.
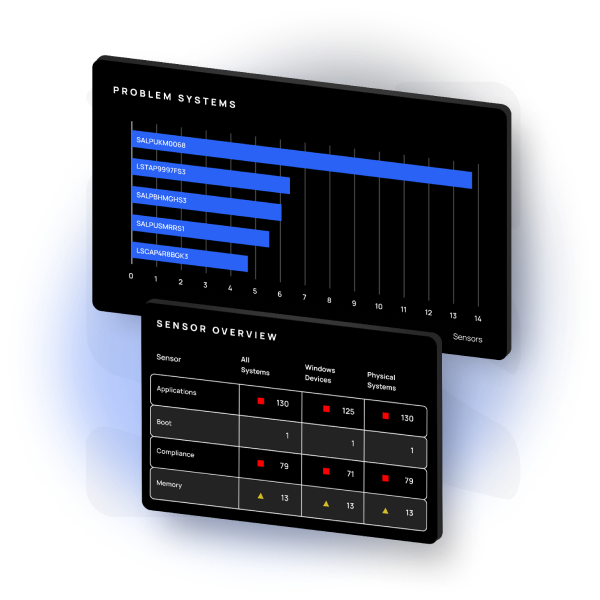
Review systems, applications and trends
Stay updated on the overall health of your IT estate by keeping track of data over time. SysTrack not only collects data from deep inside the operating system, it also collects data for all devices and retains historical data so you can see trends that help you make better decisions for applications and systems under your control.
Import and connect different data sources
Break down information silos and aggregate data so you can focus on problem-solving and not data gathering. Use data from across your monitoring and management toolbox to get a more accurate view of what is happening so you can take the right approach to fix problems and improve IT performance across the organization.
Related Integrations


Gain Greater Visibility into Your Digital Workplace
See how Lakeside’s Digital Experience Cloud, powered by SysTrack can help
your IT organization