Big Data for End User Computing: Driving Enhanced Visibility and Better Decisions
The Problem is EUC Visibility
Most organizations spend about half of their IT budget and effort on end user computing (EUC): on endpoint hardware, applications, support, and more. It’s a huge cost, and literally all of their users are touched by the experience that they get from that investment. Unlike some more intangible expenses there’s a direct effect on productivity, but a recent survey of Fortune 500 enterprises found that nearly all companies are flying blind. They don’t know what their users do with their computers, how their users use the tools provided to them by IT, or what kind of experience their users receive every day. So, 50% of their budget is committed to delivering quality experience to 100% of their people, but they have 0% visibility into their user experience. That’s not a recipe for success.
How are you supposed to figure out from that what’s really going on?
One thing is certain: to get visibility into your end user computing investment, you need a lot of information. You need to know what people have, what they actually use, how their applications and devices perform, how they’re configured, and more. That’s a monumental amount of data, and this is why it’s essential to have a Big Data Solution for End User Computing. When you have complete visibility from the endpoint to the datacenter you can deliver a better user experience more cost effectively, and this is especially true if you’re using VDI or hosted applications. All of this depends on having the information that you need to make great decisions instead of guessing.
The Solution is Evidence-Based Decision-Making
This opens the door to something we call “evidence-based decision making”. Most forward looking enterprises have started the shift to an evidence-based approach because they’re finding that there are many myths mixed into their current “best practices.” Sometimes they’ve been doing the same thing for a long time, and nobody knows why. They are shifting to the use of large, fact-based collections of knowledge as the basis for their decisions, and eliminating the guesswork and high cost of making the wrong calls.
This is exactly what Lakeside’s SysTrack software provides. In a nutshell, it builds a data repository that describes what’s happening in your EUC environment. It observes and records at an extraordinary level of detail to capture all of the granular data necessary to get real understanding. It’s architected from the ground up for low overhead and extreme scalability, meaning it’s a unique and patented solution suitable to run on every endpoint all the time. That means that your knowledge can finally be complete. It also means that when something happens, you’ll have a record of it and what caused it when you analyze the situation later.
But SysTrack is more than data: it is information. Turning raw data into useful information is not trivial. When that process fails the data isn’t very helpful by itself. SysTrack avoids this by organizing information as it is collected, storing it efficiently and preparing it for access as it is collected. That’s important, because it’s almost impossible to build the context for data after the fact. If you don’t do that organization up front, you’ll be looking for a needle in a stack of needles. This overwhelming amount of post-event analysis is one of the biggest problems with solutions that depend on mass centralization of raw data and leave you to put the pieces together. SysTrack isn’t a search engine; that kind of thing is best left to folks like Google. Instead SysTrack is designed to process and organize environmental data to make it immediately accessible. So, after collection, how do we start to get real value from this complete set of information?
The next step is applying analytics; that means doing something with the information. SysTrack supports both built-in and third party analytics. The analytics for a lot of business problems in the market today, like virtualization planning, software rationalization, hardware right-sizing, root cause analysis, and lots more are in the built-in variety: they come with the SysTrack product. But EUC is a hot market, and there are lots of creative companies who would like to do more.
SysTrack supplies easy-to-use APIs that industry partners and our customers build on; they can concentrate on their value-add, which is the analytics, and can rely on SysTrack to provide well-organized data. So, while some great analytics come from Lakeside, we realize that there are smart people out there who have great ideas for analytics and specific business cases that we haven’t thought about yet. We want to provide the foundation to power those next generation solutions. Taking and working with the information in SysTrack helps deliver the answers to some of the most complex questions anyone may ask about an environment.
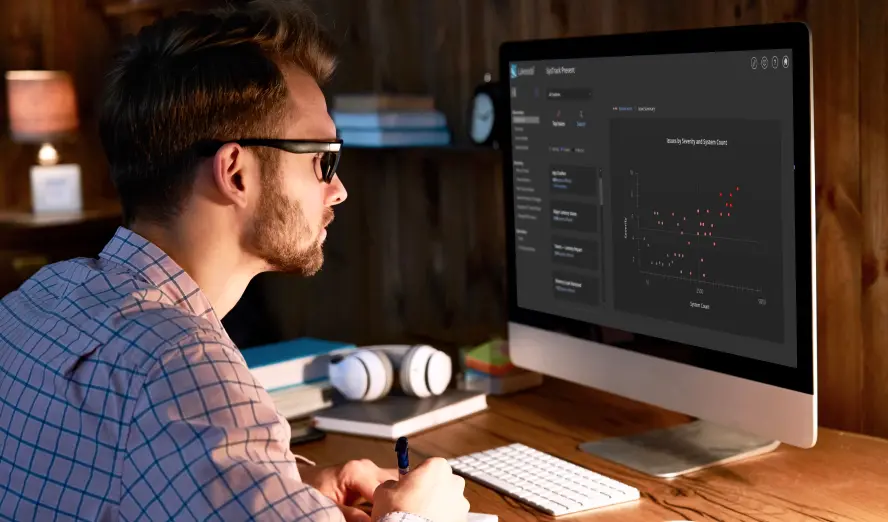
The third step is visualization. Having step one, the information collection, and step two, the analytics, in place you now need to be able to get the results into the hands of people that need it. This isn’t easy because different information consumers have different needs. Some need dashboards, some need reports, and some need detailed, granular data. To flexibly meet all of these needs, SysTrack includes a wide variety of visualization tools. That means excel-type “pure data” reports, full-scale documents that look like manuals, out-of-the-box and user-configurable dashboards, and programmatic access through APIs and PowerShell. The key point here is that you can drive visualization in whatever way is convenient to you. Most organizations use more than one.
Virtual Desktop Lifecycle
Maybe it will be helpful to be a little more specific, and some examples may help to make this more concrete. Let’s start with a look at the lifecycle for a virtualized desktop.
IT Assessments
The very first thing that everybody needs to do in order to be successful is a proper assessment. In fact, it doesn’t matter what project you’re looking at: physical to virtual, Windows 7 and 8 migrations, virtualization adoption, whatever. You first need to understand what your people are using today and what resources they need.
IT typically supports a list of applications and a handful of PC and laptop models. But what applications do your users need or want? What apps are purchased and self-installed by certain departments or teams? How hungry are those apps? Answers to these questions are important, because just missing one or two critical items here can break your project before you rack the first server or install the first image.
So, assessments are important. You’d expect that a good assessment methodology has a high degree of automation, is transparent to the users, and is accurate. Lakeside SysTrack does all of that and a number of highly successful system integrators and consultants have long standardized on SysTrack for all of their assessments in IT projects.
Transformation
Next is the actual Transformation. There’s always transformation, because if everything were static, you probably wouldn’t have much of a project. A serious complication to your project is that things continue to change while you are doing the planning. You can’t stop the user and app churn as that is part of the business. SysTrack can help deal with that.
One of the most crucial parts of the transformation is the image design. IT has to make sure to get all of the applications users depend on without bloating the images, by striking that fine balance between providing what’s really needed and not much more. You also want to see if your users are ready to make the switch once you finalize a new solution. You need to determine if all the applications are actually ready to go and identify the best order in which to migrate your users to the new platform. Lastly, you will want to have direct visibility into how things are going and adapt your project if your early adopters have a poor user experience.
Operation
With assessment and transformation completed, you still have to operate the constantly changing environment. Having a user explain an issue to the help desk is time-consuming, subjective and problematic; frequently users only see the symptom (e.g. “my computer’s slow”) and have no understanding or visibility into the underlying problem. Wouldn’t it be great to have a black box that records what has been going on so that you can have a look without having to try and replicate the problem? How about looking at system dependencies? Did you know your proxy server was 200 milliseconds away? What about raising some alarms when something goes wrong and pro-actively alerting your IT team about it? How do you know that the user isn’t just overly sensitive? Wouldn’t it make sense if you could see how their system performance is stacking up compared to everybody else in their peer group so you can determine if there is an isolated problem or a more widespread issue? That’s what IT operations is all about.
Measurement
Finally, how about measuring what’s going on? Not only purely on the IT side, but measuring business metrics so that you can really have an impact on your people and your business. The new SysTrack dashboard builder not only visualizes the SysTrack data, but actually pulls data from a lot of other sources and silos as well – that’s real data integration you can actually use. How about correlating help desk ticket volumes to system health? How about tracking application usage against owned application licenses? How about correlating user experience with productivity of your sales force or manufacturing flow? SysTrack does all that.
Summary
All right, so let’s recap – you need to have a way to make your IT decisions in an evidence-based way. To turn 0% visibility into 100% knowledge. The evidence comes from SysTrack as a Big Data for End User Computing solution that provides everything you need through the entire system lifecycle – Assess, Transform, Operate, and Measure.


Subscribe to Lakeside Updates
Receive product updates, DEX news, and more