In most companies workforce costs average about 70%. These costs are the single biggest expense of any company and companies have struggled, particularly in the economic environment of the last few years, to gain workforce efficiencies. Many of them have used the sledge hammer approach – hiring freezes, layoffs, company reorganizations – because they’ve lacked the visibility and the tools to effectively manage and optimize their workforces.
Companies have financial models, and models of key supply side and demand side processes, but what they have struggled with is creating credible workforce models. By aggregating SysTrack data with data from other workforce applications including HR, Finance, Operations and Business Unit data, we see the opportunity to create a data driven workforce model.
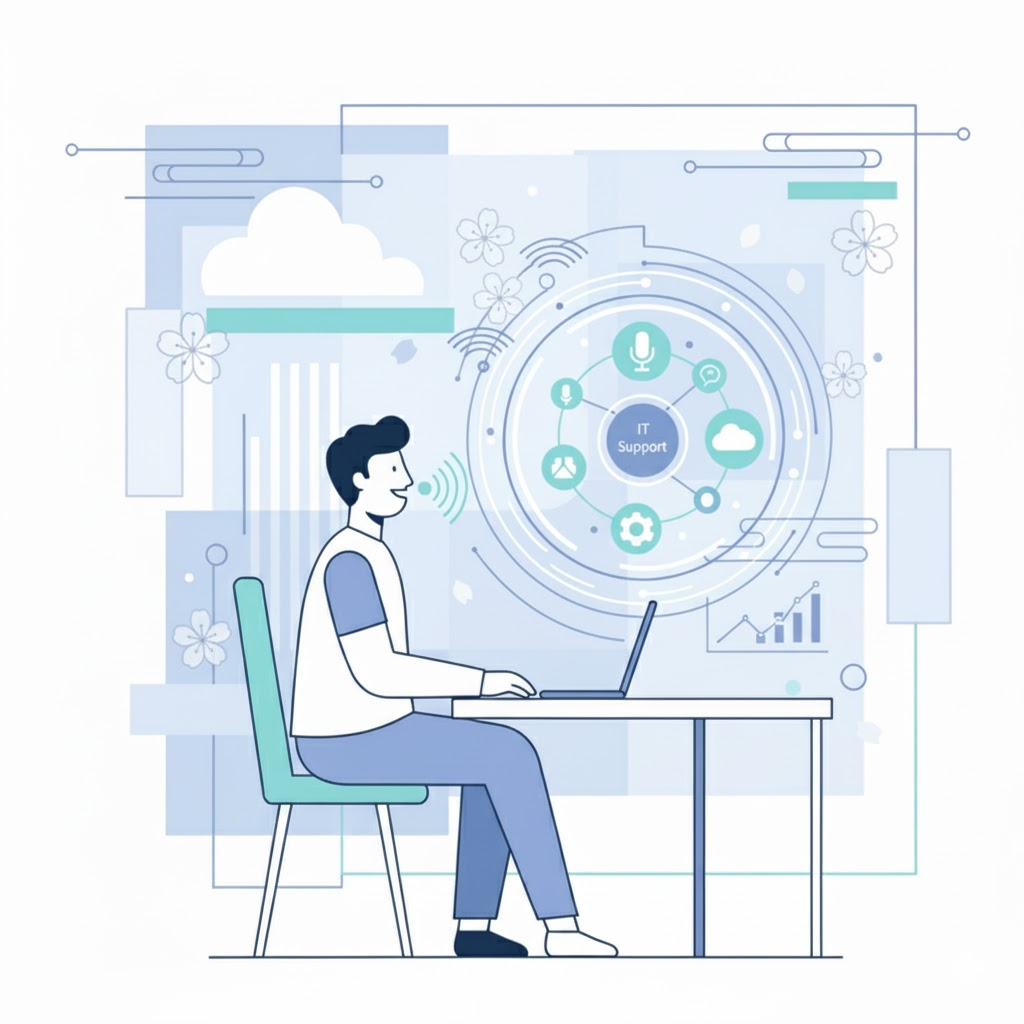
Solving workforce problems with workplace analytics software
By undertaking this effort, we believe companies can systematically assess and gain visibility to workforce patterns and insights. We see this as a game-changing opportunity to solve workforce problems that have remained allusive due to a lack of complete worker information, as well as an opportunity to better align company strategy with workforce plans. The immediate results would be better decisions, improved productivity, reduced cost, and a more competitive company. We further believe the costs of integrating the data and doing the analysis will pale in comparison to the benefits gained.
Here is just a sampling of the questions that could be addressed by this effort:
Demographics
- What is my mix of full time, part time, temporary and contract workers?
- Where are my workers located?
- How mobile are my workers?
User Experience
- What is the user experience of my employees, contractors, temporary workers?
- Which employees are most impacted by user experience issues? How does their user experience compare to those of the most productive workers?
- How are my workers using the web? Which web applications are most used?
Roles
- What are my most critical job roles?
- Who are my innovators, knowledge workers, mobile workers, process workers, and executives?
- What distinguishes their work?
- How do employee work styles compare to their formal roles?
- Do we have role duplication?
Competencies
- What are the competencies of each of my employees and where are those employees located?
- Do we have the right competencies in the right place?
Productivity
- Who are my “known” most productive workers, (i.e. workers whose work and output maps to their role)?
- What are the work patterns of my most productive workers? How long do they work? Where do they work from? What applications do they use – from where and when?
- Based on those patterns, who are my “unknown” most productive workers (i.e. workers whose work and output exceed their roles)?
- How productive are my workers based on type of site?
- From an IT perspective (h/w, s/w, network, apps) how are my most productive workers equipped versus my least productive workers?
Collaboration and Communication Flow
- What collaboration devices and applications are productive teams using? How are my workers using email, messaging, Unified Communications, the portal(s), project management, document management, video conferencing, web conferencing, calendaring and other collaboration tools?
- What collaboration devices and applications are my most productive teams equipped with versus my least productive teams?
- How and when do they use they tools?
Compliance, Risk Management, Security
- How does knowing who my employees are, how they work and where they work impact existing business continuity plans and what needs to be changed?
- What security issues exist within my worker environment?
- What external applications are my workers using?
Workplace
- How do flexible hours and alternative work places affect hiring and retention of employees?
- Based on work styles which workers could productively work from home and how would that impact my existing real estate costs?
- How much power and energy does my workforce consume and what are my savings opportunities?
Furthermore, we believe there is a game-changing opportunity to use SysTrack workplace analytics software, in combination with other databases, to build a data-driven workforce model resulting in significant competitive advantage for the enterprise.
Check out our new white paper and learn how a CIO can escape the “80/20 trap” by freeing up funding heretofore locked within the run budget and use the freed up funding to not only innovate within his/her own organization but also foster innovation across the enterprise.


Subscribe to Lakeside Updates
Receive product updates, DEX news, and more