Providing the tools necessary to complete an assessment – whether it be for migrating the workforce to a new operating system, adopting a new storage solution, or incorporating virtual infrastructure into the environment – has always been one of SysTrack’s strong suites. As the landscape of IT evolved to the cloud to accommodate for global business and mobile workforces we needed to evolve our assessment capabilities just the same. Streamlining and simplifying the process for getting all the moving parts in place to perform an assessment by moving the SysTrack master system to the cloud was the first step to aligning SysTrack-based assessments with the modern IT narrative: make it simple, make it easy to use, and make managing it available from anywhere.
SysTrack Desktop Assessment is our cloud-based service for performing VMware Horizon assessments. As the service has grown in use we’ve worked to continue enhancing it through the addition of new tools and content. It’s now easier than ever to monitor PCoIP and health data with SysTrack Desktop Assessment. An interactive dashboard was added for each, and as a part of the overall service they add great value and enhance your ability to continuously monitor the state of your environment.
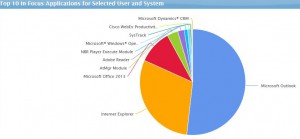
The PCoIP Summary dashboard allows you to trend average latency, average receive packet loss, and average transmit packet pass. The day over day trend line quickly illustrates typical values for the selected item, making it simple to spot an outlier that might warrant further investigation. Selecting a day of interest will display session summary details for that day to give you insight as to what may have caused the spike. Additionally you can see the top 15 users by average bandwidth use as well as session summaries and top ten focus applications for a selected user.

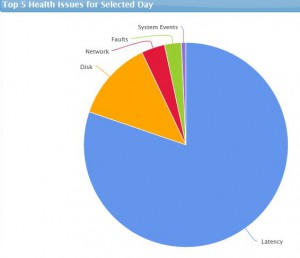
The PCoIP Summary dashboard is a good way for monitoring specific metrics, but if you’re more interested in the general health of your systems then the Environmental Daily Health Trend dashboard can offer some great insight. Similar to the PCoIP dashboard it provides a trend line that then allows you to select a date to drill down to more detailed data. The logical flow of dashboard is to select a date of interest, select a system of interest based on that system’s health score for that day, and then view the health trend of the selected system. This an easy way to uncover a particular system that may be experiencing issues leading to a poor user experience.
Once your assessment is underway it’s a good idea to be continuously monitoring and managing the health of the environment. SysTrack is, at the end of the day, all about the user experience. While providing the tools and data for doing a VMWare Horizon assessment we wanted to make sure to also provide the tools and data for looking after the users. A core component of any assessment should be examining user and environmental health to make sure there are no major issues that need to be addressed prior to completing the assessment. The PCoIP and Environmental Health dashboards allow you to do just that.


Subscribe to Lakeside Updates
Receive product updates, DEX news, and more