
SysTrack Kits – Integration and Custom Reporting
One of the most exciting features of our latest version of SysTrack (7.2) is the new Kits program. This provides use case specific reports and dashboards to cover a broad set of different operational and analytical needs for a wide set of different environments. This month we’re pleased to announce that our most requested Kit, an extensive set of Citrix reports for XenApp and XenDesktop management, has gone live and is ready for immediate use.
With our latest Kit we introduce a path to continue many of the reports and capabilities of the EdgeSight for XenApp IMA environments (versions 6.5 and earlier). This is of particular interest for customers who are migrating to and adopting the FMA based versions of Citrix XenApp (7.0 and higher). This Kit helps complete the vision into the inner workings of environmental demand that IT administrators need to guarantee success in delivering a great user experience with Citrix products.
This includes critical historical analysis and trending reports, consumption coverage, HDX utilization details, and other key items across both IMA and FMA deployments. Of course, SysTrack also extends many of the reports and analytics to the physical desktop world and infrastructure components in the data center.
The Citrix Session Reporting Kit
So, what can you expect? Through the Kits import mechanism a single import brings in dozens of Citrix specific reports which are then automatically configured to work with SysTrack and ready to go in moments. This opens the door to deep reporting on everything from peak concurrency and session trends to application consumption and network utilization.
This also integrates in with several of our Citrix monitoring dashboards that can offer operational insight into advanced session issues. As a little bit of an extra we also have the ability to directly connect into the Desktop Director and its monitoring database to relate back session state and connection details directly with our in-system user experience collection. This helps answer some of the questions left over for enterprises moving to later Citrix product releases.
The obvious question: how do I get started? Directly from the SysTrack Launch page you can click through to the Kits area to get to the import center. From here, logging in with your SysTrack Portal Account credentials reveals the list of kits you have available. Find the Citrix Session Reporting Kit and select Import. This imports all the reports found in the table at the end of this post, but we’ll only cover a handful in this post.
Citrix Session Dashboards
One of our newer tools is the SysTrack Dashboard Builder. There are a number of Dashboards that come with the Citrix Session Reporting Kit, so we’ll start here to give an idea of what’s presented. Note that the Citrix Session Reporting tag lets us filter for just the dashboards contained in this Kit.

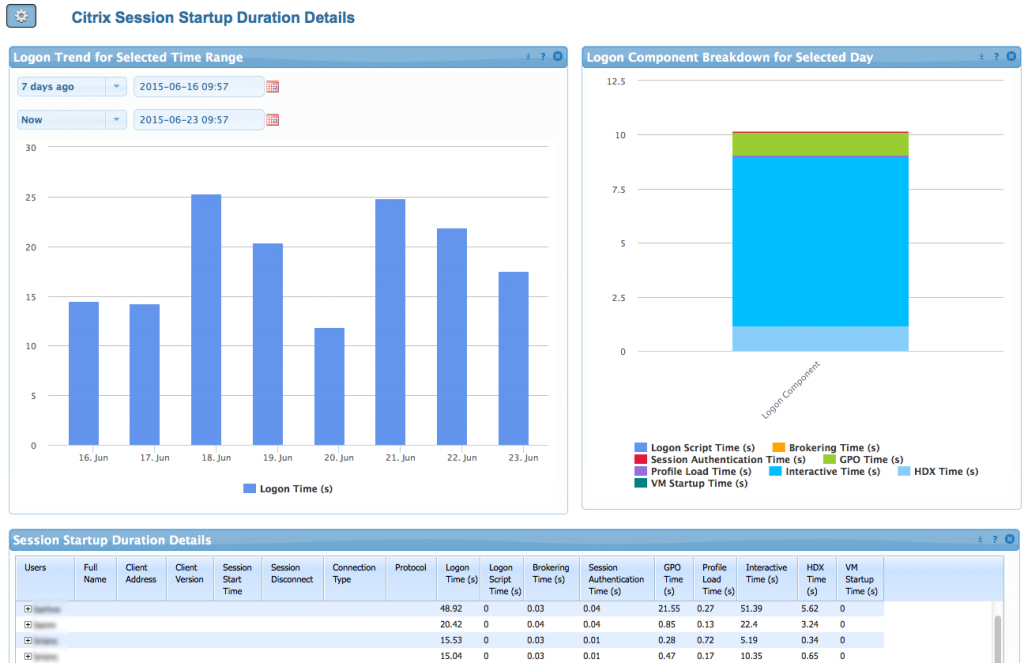
One of the first dashboards to check out is Citrix Session Startup Duration Details. This actually makes use of a Shared Data Source, so we’ll want to start in the Dashboard Builder to set up the connection to the Director database. Specifically, we’re interested in the MonitorData information, so if you’ve got your database distributed between multiple database objects make sure to select the right one. In our case we just have one database, so I’ll configure the Shared item to be used in each data block to use it. Note that I just have to do this once, and any future dashboard that uses that connection can just use our Shared item.

Now you can see a logon trend as well as a component breakout for a selected day with a complete record of your user session timings.
Naturally there are some unique SysTrack dashboards as well, and many of them use our Health Score to articulate how well people are enjoying their sessions. For example, the Citrix XenApp Published App Health with Session Concurrency dashboard uses our XenApp view to show details about health concerns and concurrency of demand for publishes applications in use in the environment.

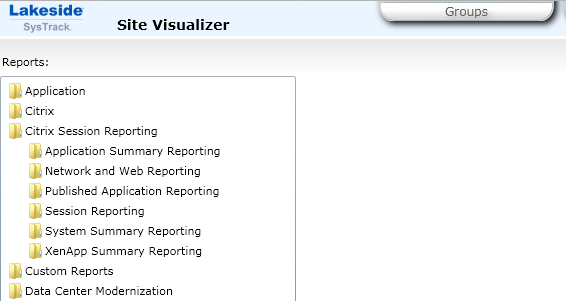
SysTrack Reporting for Citrix Sessions
The majority of the reporting content is found in our SysTrack Reporting area. That feature is built into Site Visualizer and Report Center to provide easily exportable content. The Citrix Session content can be found in the Citrix Session Reporting folder and is organized by type (Figure xx).
As an example, let’s check out the Session Count by Day report. This has a breakout of the count of sessions on each app host over the time range you specify.

This and many other categories of reports exist to make finding the specific reporting you’re looking for simple. Obviously we can’t go through every item here, so check out the table at the bottom to see how some of the available reports from EdgeSight 5.4 maps into our Kit. Because this is community driven feel free to make requests as well.
As a side note, we’ve got a significant library of Kits available now in addition to our Citrix Session Reporting Kit, including some focused on security, NVIDIA graphics analysis, and data center modernization. Look for more as our collection grows.
| Mechanism | Edgesight | Systrack Report |
|---|---|---|
| Dashboard | ICA client version | ICA Client Version |
| Dashboard | License Server Monitor Archive | Citrix License Consumption in Different License Models |
| Dashboard | New Processes | New Processes |
| Dashboard | Session Auto-Reconnects | Session Reconnect Count |
| Dashboard | Session Server Startup Duration | Citrix Session Startup Duration Details |
| Dashboard | Session Startup Duration Details | Citrix Session Startup Duration Details |
| Dashboard | XenApp Summary | XenApp and XenDesktop Summary |
| Dashboard | XenApp User Summary | XenApp and XenDesktop Summary |
| Dashboard | XenDesktop Summary | XenApp and XenDesktop Summary |
| Dashboard | XenDesktop User Summary | XenApp and XenDesktop Summary |
| Operations | Alerts | Operations |
| Operations | Hardware Alerts | Operations |
| Resolve | Assets for a Device | Resolve |
| Resolve | Reboots | Resolve boot/login area |
| Resolve | System Page Faults | Resolve |
| Resolve/Operations/vScape | Real-Time Alert List | Resolve/vScape for real-time data |
| Resolve/Operations/vScape | Real-Time Device Summary | Resolve/vScape for real-time data |
| Resolve/Operations/vScape | Real-Time Network Performance | Resolve/vScape for real-time data |
| Resolve/Operations/vScape | Real-Time System Compare | Resolve/vScape for real-time data |
| Resolve/Operations/vScape | Real-Time System Performance | Resolve/vScape for real-time data |
| Resolve/Operations/vScape | Real-Time XenApp Summary | Resolve/vScape for real-time data |
| Resolve/Operations/vScape | Real-Time XenApp User Summary | Resolve/vScape for real-time data |
| SysTrack Reporting | Asset Changes | Asset Changes |
| SysTrack Reporting | Environmental Usage | Published Application Launch Count Details |
| SysTrack Reporting | Event Log Alerts | Event Log Alerts/operations |
| SysTrack Reporting | Event Log Alerts for a User Group | Event Log Alerts/operations |
| SysTrack Reporting | Hardware Asset Changes | Asset Changes |
| SysTrack Reporting | HDX MediaStream I/O | Session Details |
| SysTrack Reporting | HDX Plug-n-Play I/O | Session Details |
| SysTrack Reporting | ICA Audio I/O | Session Details |
| SysTrack Reporting | ICA Drive I/O | Session Details |
| SysTrack Reporting | ICA Printer I/O | Session Details |
| SysTrack Reporting | ICA Session Compression | Session Details |
| SysTrack Reporting | ICA Session I/O | Session Details |
| SysTrack Reporting | ICA Session Latency | Session Details |
| SysTrack Reporting | ICA Session Latency for a User Group | Session Details |
| SysTrack Reporting | New Sites | New Sites |
| SysTrack Reporting | Port Network Volume | Port Network Volume |
| SysTrack Reporting | Process CPU | Application CPU and Memory Details |
| SysTrack Reporting | Process Memory Usage | Application CPU and Memory Details |
| SysTrack Reporting | Process Network Volume | Application Network Volume |
| SysTrack Reporting | Process Not Responding Alerts | Application Hang Summary |
| SysTrack Reporting | Process Not Responding Alerts for a User Group | Application Hang Summary |
| SysTrack Reporting | Process Performance Summary by Process | Application Performance Summary |
| SysTrack Reporting | Process Stability Summary by Process | Application Stability Summary |
| SysTrack Reporting | Process Usage | Application Usage |
| SysTrack Reporting | Published Applcation User Count Details | Published Application Launch Count Details |
| SysTrack Reporting | Published Application Launch Count Details | Published Application Launch Count Details |
| SysTrack Reporting | Published Application Launch Count for a User Group Details | Published Application Launch Count Details |
| SysTrack Reporting | Published Application Launch Summary | Published Application Launch Summary |
| SysTrack Reporting | Published Application Summary | Published Application Launch Count Details |
| SysTrack Reporting | Published Application Summary for a User Group | Published Application Launch Count Details |
| SysTrack Reporting | Published Application User Count for a User Group -Details | Published Application Launch Count Details |
| SysTrack Reporting | Published Application User Summary | Published Application User Summary |
| SysTrack Reporting | Published Application User Summary for a User Group | Published Application User Summary |
| SysTrack Reporting | Published Appliction Launch Summary for a User Group | Published Application Launch Summary |
| SysTrack Reporting | Session Client and Server Startup Duration | Session Ready Time |
| SysTrack Reporting | Session Client Startup Duration | Session Ready Time |
| SysTrack Reporting | Session Client Type | Session Client Type |
| SysTrack Reporting | Session Counts | Session Count by Day |
| SysTrack Reporting | Session CPU | Session Resource Consumption Details |
| SysTrack Reporting | Session CPU for a User Group | Session Resource Consumption Details |
| SysTrack Reporting | Session Duration | Session Resource Consumption Details |
| SysTrack Reporting | Session Duration for a User Group | Session Resource Consumption Details |
| SysTrack Reporting | Session Login Time | Session Login Time |
| SysTrack Reporting | Session Login Time for a User Group | Session Login Time |
| SysTrack Reporting | Session Memory | Session Resource Consumption Details |
| SysTrack Reporting | Session Network Bandwidth Used | Session Details |
| SysTrack Reporting | Session Network Volume | Session Network Volume |
| SysTrack Reporting | Site Network Volume | System Network Volume |
| SysTrack Reporting | Software Asset Changes | Asset Changes |
| SysTrack Reporting | System CPU | System Summary |
| SysTrack Reporting | System CPU Summary | System Summary |
| SysTrack Reporting | System Disk Usage | Daily Performance Summary |
| SysTrack Reporting | System Disk Usage Summary | Daily Performance Summary |
| SysTrack Reporting | System Kernel for a Device | System Summary |
| SysTrack Reporting | System Memory For a User Group | System Summary |
| SysTrack Reporting | System Memory Summary | System Summary |
| SysTrack Reporting | System Memory Usage | System Summary |
| SysTrack Reporting | User Logon Counts | User Logon Counts |
| SysTrack Reporting | User Logon Details | User Logon Details |
| SysTrack Reporting | User Logon Details for a User Group | User Logon Details |
| SysTrack Reporting | Visited Sites | Visted sites |
| SysTrack Reporting | XenApp Server Utilization | XenApp Server Utilization |
| Visualizers | Device Summary | Enterprise Visualizer for summary, Site Visaulizer/Resolve for selected system |
| Visualizers | Process Errors | Application Faults/Site Visualizer App Faults dataset |
| Visualizers | Process Faults | Application Faults/Site Visualizer App Faults dataset |
| Visualizers | Process Faults for a User Group | Application Faults/Site Visualizer App Faults dataset |


Subscribe to Lakeside Updates
Receive product updates, DEX news, and more