SysTrack Use Case: Investigating Problem Applications with SysTrack
One of the goals at Lakeside is to make IT systems as transparent as possible so as to reveal the problem areas in the environment that most need to be addressed in order to improve the end-user experience. Some of the most frequent culprits impacting end-user experience are applications with excessive and unexpected resource consumption or continual faults, errors, and hangs. Fortunately, SysTrack provides several tools and various methods with which these problem applications can be addressed. I’ll be giving a quick walkthrough of these, covering the cases in which the problem application is unknown and needs to be identified and then moving into how to go about monitoring a known problem application more closely. In no way will the list of methods I provide be exhaustive but they can serve as a strong starting point.
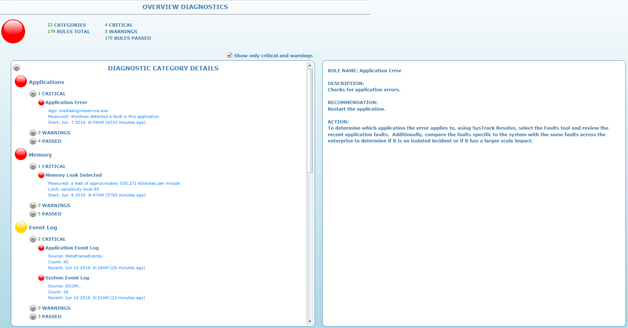
Let’s begin with the first case, the unknown application that is potentially tanking performance and productivity and just being a general pain for end-users. Assume for a moment that there have been reports of impacted performance on several systems in the environment and a handful of rather unhelpful support tickets have been generated. “My Outlook is slow, my internet is taking forever, my BLANK keeps crashing.” You have a – hopefully short – list of users, systems, and the times at which they were experiencing difficulty; but where do you start the search? The first tool to utilize when given such a specific location and timeframe is SysTrack Resolve. Launch Resolve and change focus to select a system to observe, then navigate to the Overview section to see a list of all recent impacts on end-user experience discovered by SysTrack.

This will provide some context as to with which areas a system may be struggling. If there are a large number of reported application errors or consumption related events visible here, then it should prove much simpler to identify the source of these in the next step due to their frequency. Once we’ve had that cursory look next we’ll dive into the black box and select a timeframe during which users have reported problems with the system. Highlight an area of the chart with high or unexpected resource consumption by clicking there and the applications panel will display the resource consumption of each application that was running at that point in time.
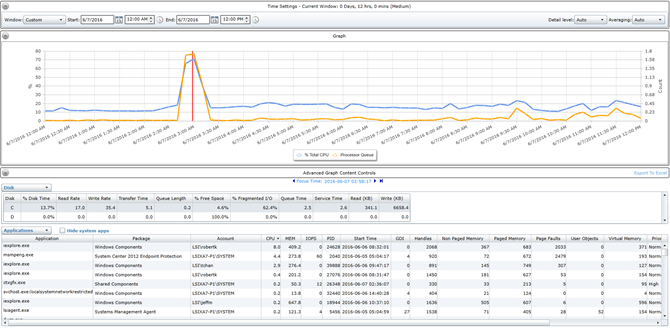
By observing the applications at that given point in time it’s possible to find applications that are impacting the end-user by correlating the system performance with the application’s consumption and begin to address the possible causes. Once some of these problem applications have been found and triaged it may become apparent that several of them should be monitored more closely to limit or prevent future impact. That’s where the next set of tools come in, the ability to create and report on custom alarms. Within SysTrack Deploy, the SysTrack deployment tool, under Alarms and Configuration > Scripting and Response Time it’s possible to create custom SQL scripts for a system configuration that run against the child database at set intervals of time, compare their results to a threshold, and generate custom alarms that make their way up to the master.
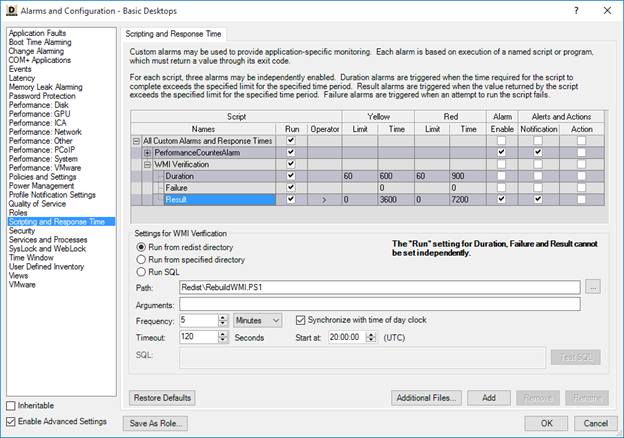
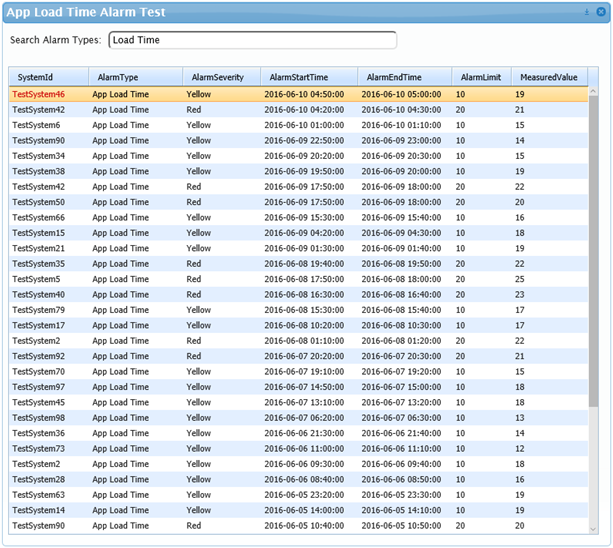
Say for example that one of the problem applications in your environment has excessive application load times that are indicative of a poor end-user experience and you need to know when they happen. A series of custom alarms could be implemented that that run every 10 minutes and report the maximum application load time for the past 10 minutes, filtered to only include the problem application. If the returned value is greater than 10 seconds or 20 seconds then a Yellow or Red alarm is generated respectively. Alternatively, the script itself could contain the thresholds and return a count of the number of applications that exceed said threshold in an alarm. Combining these custom alarms in an environment would provide much needed data that allows IT personnel to quickly locate periods of time when the target application was “acting up” and also gauge how common and frequent this behavior is.
Once this monitoring data has been generated you then need a way to readily access it. Since the alarms themselves are already custom, I find that it works best to rely on another custom tool, the SysTrack Dashboard Builder, to filter out unwanted alarms and focus on just the ones we want. Use a simple drag-and-drop interface and a little SQL knowhow to filter the results and you can get an excellent look at the data you want.
There’s no way of knowing exactly which pieces of information will be important for every given application, but with the robustness and flexibility provided by SysTrack it’s possible to identify what you need to know and put systems in place to monitor it. By familiarizing yourself with your environments problem applications at present you can keep them from being the problem applications of the future.
Subscribe to Lakeside Updates
Receive product updates, DEX news, and more


