
Data Vs. Information | Defining Data Quality and Value

Questions about how to assess data quality and transform end-user data into insights are among the first steps when considering rolling out a digital transformation initiative. Do we already collect the data we need? You may wonder. There are three basic questions you can follow up with to determine your organization’s data preparedness:
Are you collecting data…
- of sufficient quality to inform decision-making?
- that helps you easily understand end-user experience and performance KPIs in your environment?
- at the source of digital experience: the endpoint?
If you answered “Yes!” to all three, congratulations! You’re either ready for or well on your way to experiencing the benefits of digital transformation. If not, continue reading to learn how to evaluate and select high-quality data that will deliver actionable information about your end-user computing environment.
How to Determine Data Quality
Anyone with a rudimentary knowledge of statistics knows that not all data is created equal. However, it can be challenging to define and identify what constitutes “high-quality data,” as requirements vary by intended use. For example, when monitoring key services, how real-time data is may be a more important factor in data quality than whether the dataset is complete.
You may be familiar with the “four Vs” of big data (velocity, variety, volume, and veracity), which define the parameters of a big-date initiative. “Veracity” speaks to data quality and the trustworthiness of the data source. Frequently, data quality is broken down further into characteristics to make assessment easier, including aforementioned timeliness and completeness along with accuracy, validity, consistency, and availability. While not exhaustive, these qualities are useful for evaluating the utility of data collected by a monitoring solution.
Getting started with digital experience monitoring? Here’s what you need to know
Timeliness
How long is the data relevant for?
Depending on the use case, real-time or historical data (or a combination of the two) may be more important. For example, asset data such as an end user’s hardware will typically remain relevant longer than a more time-sensitive event, such as an app crash.
Completeness
Does the data tell the full story?
If data can only be collected when an end user is on the corporate network, data completeness may be an issue. For example, an end user may take his or her laptop home and continue working, all the while generating potentially uncaptured data relating to system usage and performance. Endpoint data collection avoids this issue by continuously gathering data on any instrumented system.
Accuracy
Is the data telling the truth?
This is probably the characteristic that most of us think of first when evaluating data quality. Outliers, duplicate data, and other noise can affect data accuracy. Data normalization helps to improve data integrity by reducing redundancy.
Validity
Is data labeled and formatted correctly?
For data to be processed by machines, it must be in a format that the machine will recognize and accept. If the expected input is a numerical RGB color value, for example, “sky blue” would be invalid.
Consistency
Is data labeled and formatted the same throughout?
Related to validity, data consistency helps ensure that data can be processed in a meaningful way by not obscuring related data points. For instance, data with the same date labeled alternatively as day/month/year and month/day/year would be inconsistent.
Availability
How often can the data be accessed?
Service level agreements (SLAs) are typically established to ensure data availability and data backups are important in the event of a service outage. IT needs high data availability to service globally-dispersed end user populations and to ensure uptime of critical services.
Turning Data into Information
Now that you know some basics about judging data quality, let’s move on to the more interesting part: how to discover meaningful insights. After all, even the most pristine data is only as valuable as what it can reveal and what decisions it enables for the business.
How is data different from information? I’ve been the nitpicker of definitions before when I attempted to unlock the differences between the workplace and the workspace, but, while similar nuances exist when comparing data and information, thankfully much more has been written about the latter two. Etymologically speaking, “information” predates “data” by roughly 250 years. Suffice to say, what we commonly think of as data has changed a lot since the 1640s, so the discrepancy is really closer to 600 years.
Meanwhile, although our understanding of what information means has expanded over time (with “information technology” at a spritely 60), its definition has remained more or less constant for centuries. I hope you’ve stayed with me through this mini linguistics lesson, but my point is that it’s no great mystery why there is friction when thinking about how the two terms relate: one has been a part of the English language since the plague, while the other probably most commonly conjures thoughts of cellular plans, privacy, and Matrix-esque binary streams.
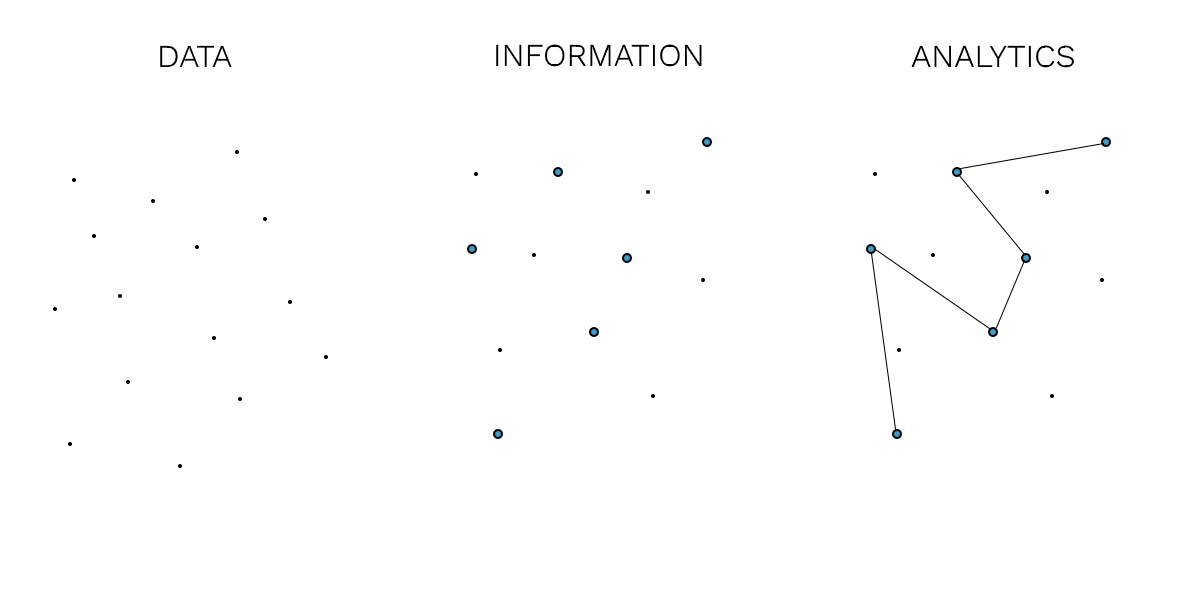
With that in mind, here are basic definitions of data and information that are useful in an analytics context:
Data – Discrete or continuous values collected and processed by a computer.
Information – Meaning derived from observation of data, which may or may not require further data processing. Whether data has meaning is contextual and depends on the perception and needs of the observer.
Key performance indicators (KPIs) are an example of data that is generally also regarded as information. As their name implies, KPIs tell a story about the level and direction of major operational concerns. For IT, performance KPIs such as CPU, disk, and memory utilization help to identify and solve problems faster, provide baseline details and considerations for projects, and represent higher-level talking points and goal-setting criteria.
KPIs give organizations a leg up on analytics compared to lower-level data. You can read about more KPIs and their uses in this free white paper.
How Do You Know Your Data Is Working for You?
According to Gartner, most organizations are lagging in data and analytics, with only nine percent of organizations having reached sufficient maturity to reap transformative benefits. One of the main roadblocks is an inability to clearly demonstrate the value of data and analytics projects. This uncertainty is understandable given the vast amount of data an organization generates, the cost of implementing new solutions, and the difficulty of quantifying project success.
Identifying what you hope to learn from the data and vetting solutions will help reduce uncertainty; however, the ultimate test of whether your data is working for you is if it is enabling you to make decisions about how you can improve your environment. When those decisions start showing results and KPI improvements, you’ll know that your data is translating into valuable information.
SysTrack, Lakeside’s workspace analytics solution, helps solve this dilemma with a unique KPI called the end-user experience score. This score considers a host of other KPIs and usage data collected at the endpoint to deliver both real-time and trending information on how performance is impacting end-user productivity. The end-user experience score can be used to quantify the success of myriad IT initiatives by measuring their effect on end users, including desktop transformation projects like VDI and OS upgrades.
With over 20 years of experience in delivering EUC solutions, Lakeside knows the workspace better than anyone else. Request a demo to learn how you can leverage the power of the endpoint at your organization.
Want to learn more about how technology is affecting business metrics like productivity? Listen to the latest episode of our podcast in iTunes or Google Play.


Subscribe to Lakeside Updates
Receive product updates, DEX news, and more