
Database administration is an important role within IT. Ensuring the backend infrastructure is available and functioning well is critical to the end users. If a SQL Server that’s hosting the backend of a Citrix XenApp farm has no available disk space then users won’t be able to launch any new sessions, which would cause massive problems for any company. It’s a simple example with big consequences, but database administration is often avoiding the big consequences by watching the little things. SysTrack natively collects a lot of great SQL Server related data, and we’ve launched a SQL Server Administration Kit to provide some focused dashboards and reports to visualize that data. Here’s an overview of the content you’ll find in the Kit.
SQL Server Inventory and Overview
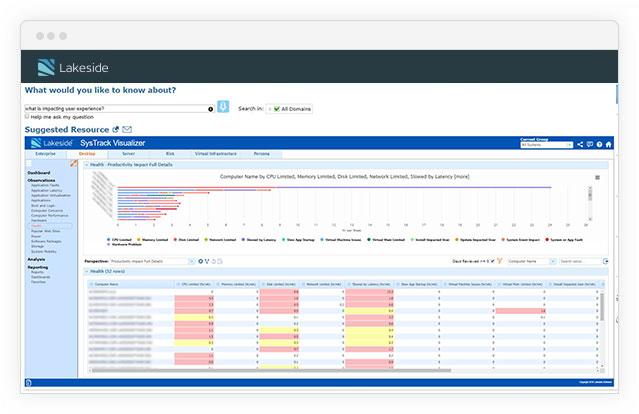
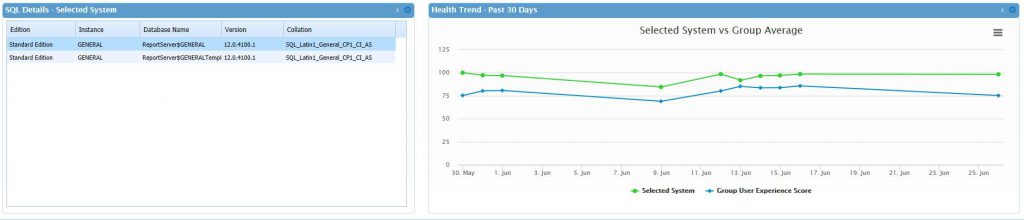
This dashboard provides a concise overview of the observed SQL Servers. Having this kind of information readily available and nicely summarized makes it easy to keep track of your SQL assets. The dashboard includes basic resource allocation, database configuration details, and system health observations and trends. A great use case for this dashboard is checking resource allocation against the system health. If, for example, memory is the leading health impact, you can instantly see the allocated memory and decide if adding more makes sense. Also included is a drill-down to SysTrack Resolve, making the jump from basic observations like that to diving into more detailed data as easy as double-clicking the system name.
SQL Server Performance
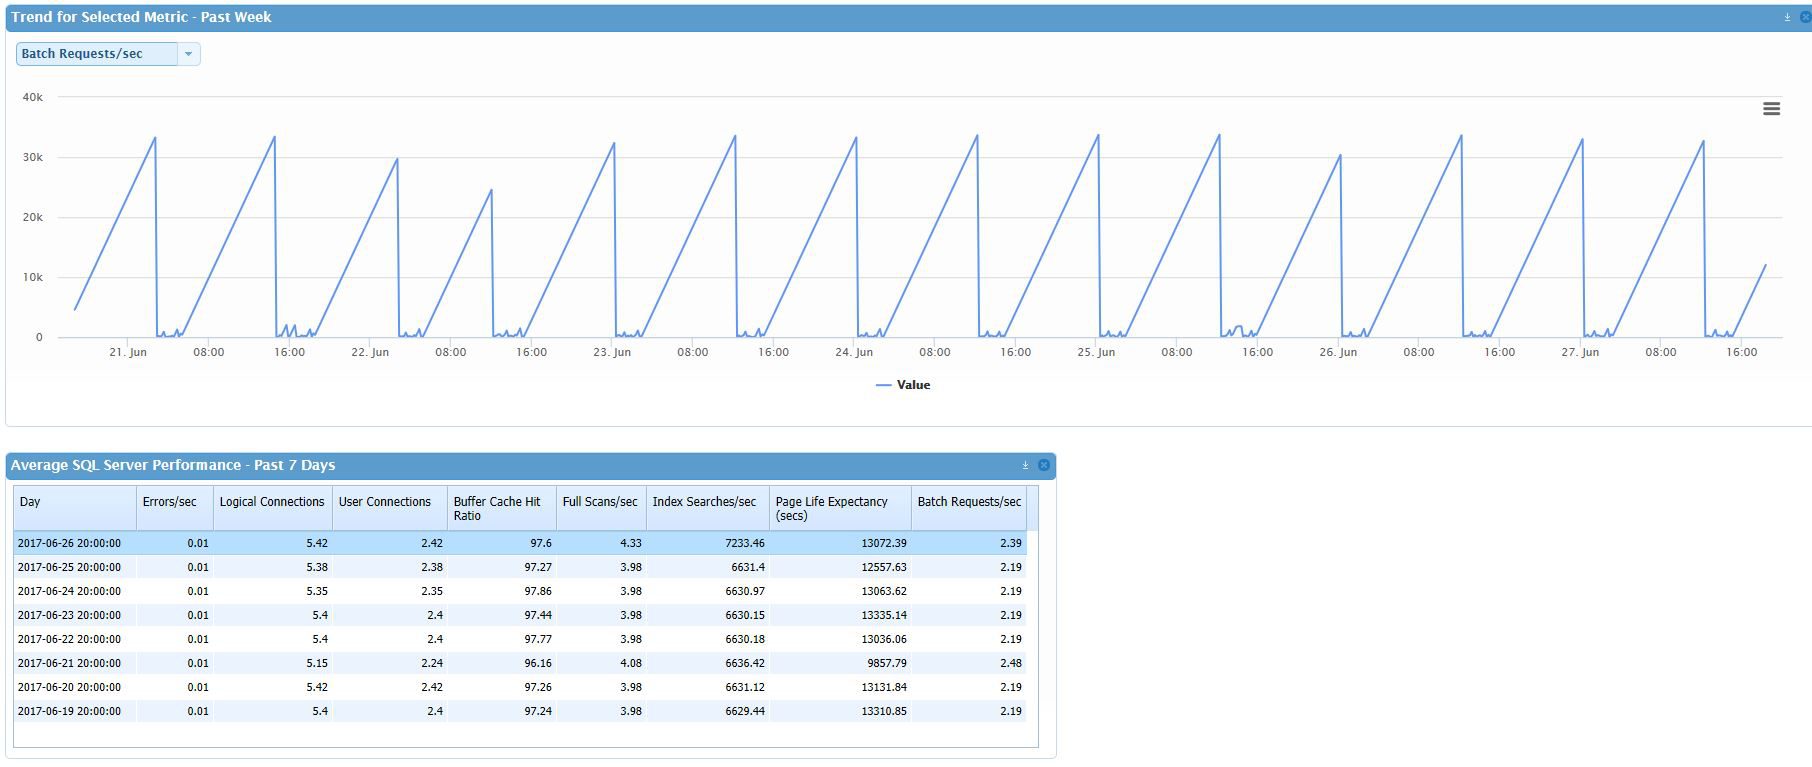
Another useful dashboard, this one’s focused on both what’s impacted the system health over the past week, and the trending and aggregated performance data over the past week for key SQL performance metrics. The SQL performance metrics are important to provide another level of detail to standard performance metrics, and add some context around why certain aspects of the system health are trending the direction they are. Available metrics are errors/sec, buffer cache hit ratio, logical connections, user connections, full scans/sec, index searches/sec, page life expectancy, and batch requests/sec.
SQL Server Overview
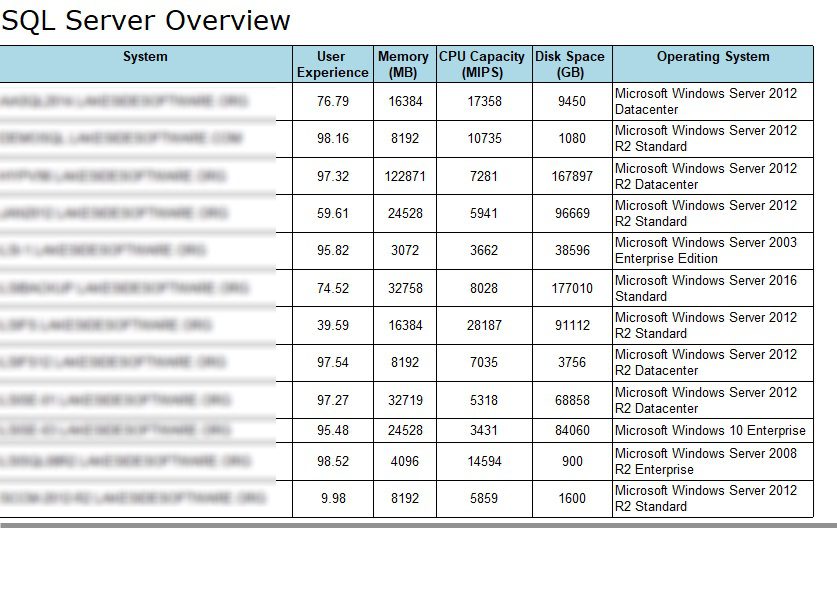
This SSRS report has similar data to the SQL Server Inventory and Overview dashboard. It includes the system health, resource allocation, and operating system. Having this data available as a formatted, static report makes it very easy to quickly view the data as well as export to Excel, PDF, or Word for offline use.
Summarizing data and providing use-case driven content packs are the whole idea behind our Kits. We’re happy to have expanded the available Kits to include SQL administration. Making IT easier and more data driven is our goal, and we’ll keep improving and expanding our Kits to continue that goal!


Subscribe to Lakeside Updates
Receive product updates, DEX news, and more