There are few companies that I truly admire. Most tech companies specifically start with a really cool idea and then tend to lose some of their focus on innovation as they grow up. Not so NVIDIA – Other than recognizing NVIDIA as a maker of most of the graphics cards I put into my PCs over the years, I didn’t know much more about them until I attended and spoke at last year’s GTC conference. What a phenomenally nerdy crowd! Tons of attendees (and employees) hold PhDs and do some really cool stuff with parallel computing using GPUs that goes much beyond graphics. The applications are endless in science and make me reminisce of the days in the mid-90s where I programmed a DEC VAX using a mix of FORTRAN 77 and FORTRAN 90 to solve non-linear differential equations as part of a physics project. Hey, energy bands in solid state physics don’t come easy!
I digress – the introduction of the Shield cloud gaming console was a cool milestone. The NVIDIA team set out to solve a very hard problem and target it at the most critical user group. The problem can be described as remoting 3D graphics and the user group targeted with the Shield were those hard core gamers who wish they could take their water-cooled $5,000+ gaming PC to bed with them and keep playing while their significant other is looking for a bit of physical proximity. Who would not want to keep roaming around Kryat without having to abandon their girlfriend or boyfriend? Any lag or reduction in the all-important frames-per-second metric would cause those guys or girls to toss the device, take their blanket and red bull move back towards their desks. So, this simply had to work and NVIDIA attempted to solve this problem not because it was easy, but because it was hard.
This technology appeared to be the pre-cursor to remote professional graphics and builds on NVIDIA’s success with the Quadro product line. The new thing is called GRID and allows customers to add GPU boards to servers in the datacenter and then pass a full or partial GPU through to a virtualized workload running on the server on top of a hypervisor.
The results are nothing but spectacular and allow organizations to bring the core benefits of application and desktop virtualization to a very demanding user group – engineers. Both VMware and Citrix are supporting virtual GPUs now. I am going to describe a use case with Citrix XenApp, but it’s equally applicable to VMware implementations and even physical desktops.
A use case of virtual GPU with Citrix XenApp
Over the years, organizations have used Citrix XenApp and its predecessors to centrally execute applications and let user access them remotely. This had two primary benefits: IT could centrally manage and update those applications without having to worry much about the capabilities or physical location of the users end-points, and secondly centralize the backend data in the datacenter without having that important intellectual property float around on hundreds or even thousands of laptops and PCs. That approach worked very well for applications that were playing nicely on a server operating system, did not require user admin rights, and were not relying on GPUs as servers back then didn’t really have those.
Then, the industry tried to tackle the problem of remote developers and software engineers that need their integrated development environments and other little tools to do their work. This gave rise to the development of VDI, which now allowed an entire desktop Windows operating system instance (as opposed to a server OS) to be made accessible remotely. That was another major milestone that also gave rise to a trend in the industry of remoting entire desktops for broader purposes. But still, the entire 3D graphics aspect of applications had to be done by the CPU without the benefit of having GPUs around.
NVIDIA fixed that by introducing the GRID product line and vendors like Citrix and VMware have introduced GPU virtualization support in their hypervisors. Now, organizations can centralize the intellectual property behind core engineering applications and be comfortable that their very demanding and very expensive users have a good user experience. Did I say comfortable? Well, most IT shops want to know and want to be proactive about the user experience and that’s where Lakeside SysTrack comes in.
About a year ago, we started shipping NVIDIA GPU support in our award winning SysTrack product and have been working with customer and partners since then to do two important things:
First, look at existing physical workstations and measure the GPU consumption in order to make a decision on the specific virtual GPU a user might need, and secondly (and more importantly) allow customers to directly monitor the resource consumption on their GRID enabled servers and virtual desktops in order to maintain a great user experience.
By the way, I am honored to have the opportunity at this year’s GTC conference to speak about both of those topics, but I would like to provide a quick sneak preview of the technology.
In this particular example, an organization has built a Citrix XenApp farm on a number of physical servers. Each physical server is running Citrix XenServer and has a single GRID K2 card, which contains two separate GPUs on the same board. Each physical server runs two virtual Citrix XenApp servers and each of those has access to a full GPU via the GPU pass through configuration.
This particular environment was designed, sized, and built based on – well, let’s say – intuition, experience, gut, and some known best practices. In other words, this organization had little initial data to predict how these servers would be utilized and if the allocated resources would be enough to satisfy the users. This is not that unusual, as the tools to assess user needs are not nearly as widely known or used and organizations often over-provision environments to be on the safe side. In the end, nobody complained, which is arguably the first success criteria for any IT organization, but nobody in IT knew the facts about the user experience either. This is where SysTrack was introduced. The environment is running the latest version 7.1 and we provided a very specific dashboard to the organization to show all of the important key metrics in a single pane-of glass. Let’s have a look:

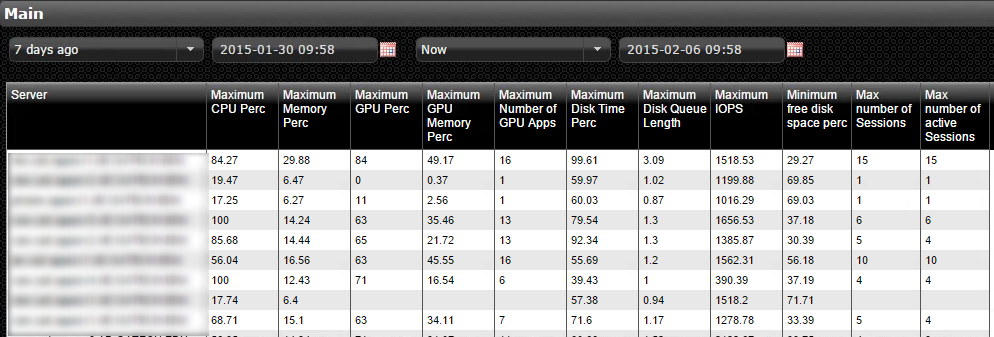
First, I select a date or time range of interest. In this example, it’s simply the last seven days. I see a list of all my XenApp servers and for each one details the high water marks – max CPU utilization, Max memory, max GPU utilization, max GPU memory, max # of GPU enabled apps, max disk time, max disk queue length, max IOPS, max number of total XenApp sessions and max number of active sessions.
One thing that becomes immediately apparent from the data is that I have two servers where the CPU spiked to 100% but the memory utilization never went beyond 30%. This means that I had more memory than I needed (better that than too little!) and I also see that no GPU went above 84% and the GPU memory utilization never exceeded 50%. This basically means that the K2 GPU is adequate for the work load and it has plenty of memory for the applications running. I do see disk times and disk queue length coming up there and that may indicate that I could have used faster or higher performing storage. The peak utilization was 15 users on the very first server in the list.
Again, these are just the high water marks. Let’s now have a look at the data over time for this particular server:


One thing that becomes clear is that GPU utilization is very “bursty” – so much so, that it doesn’t make much sense to report on average GPU consumption, because the averages will always be relatively low. Unlike an example related to PC gaming, where GPU utilization is consistently high, engineering applications are relatively easy on the GPU until a user rotates a 3D model or kicks off a complex calculation.
Again, in this case we don’t see spikes going all the way up to 100% GPU utilization which leads to the conclusion that the K2 GRID GPU that is being passed through to this XenApp server is adequate for the use case.
It may also be interesting to look at the number of applications that are calling on the GPU:

Other performance indicators include the storage sub system and we can look at % Disk Time, Disk Queue Length and IOPS:


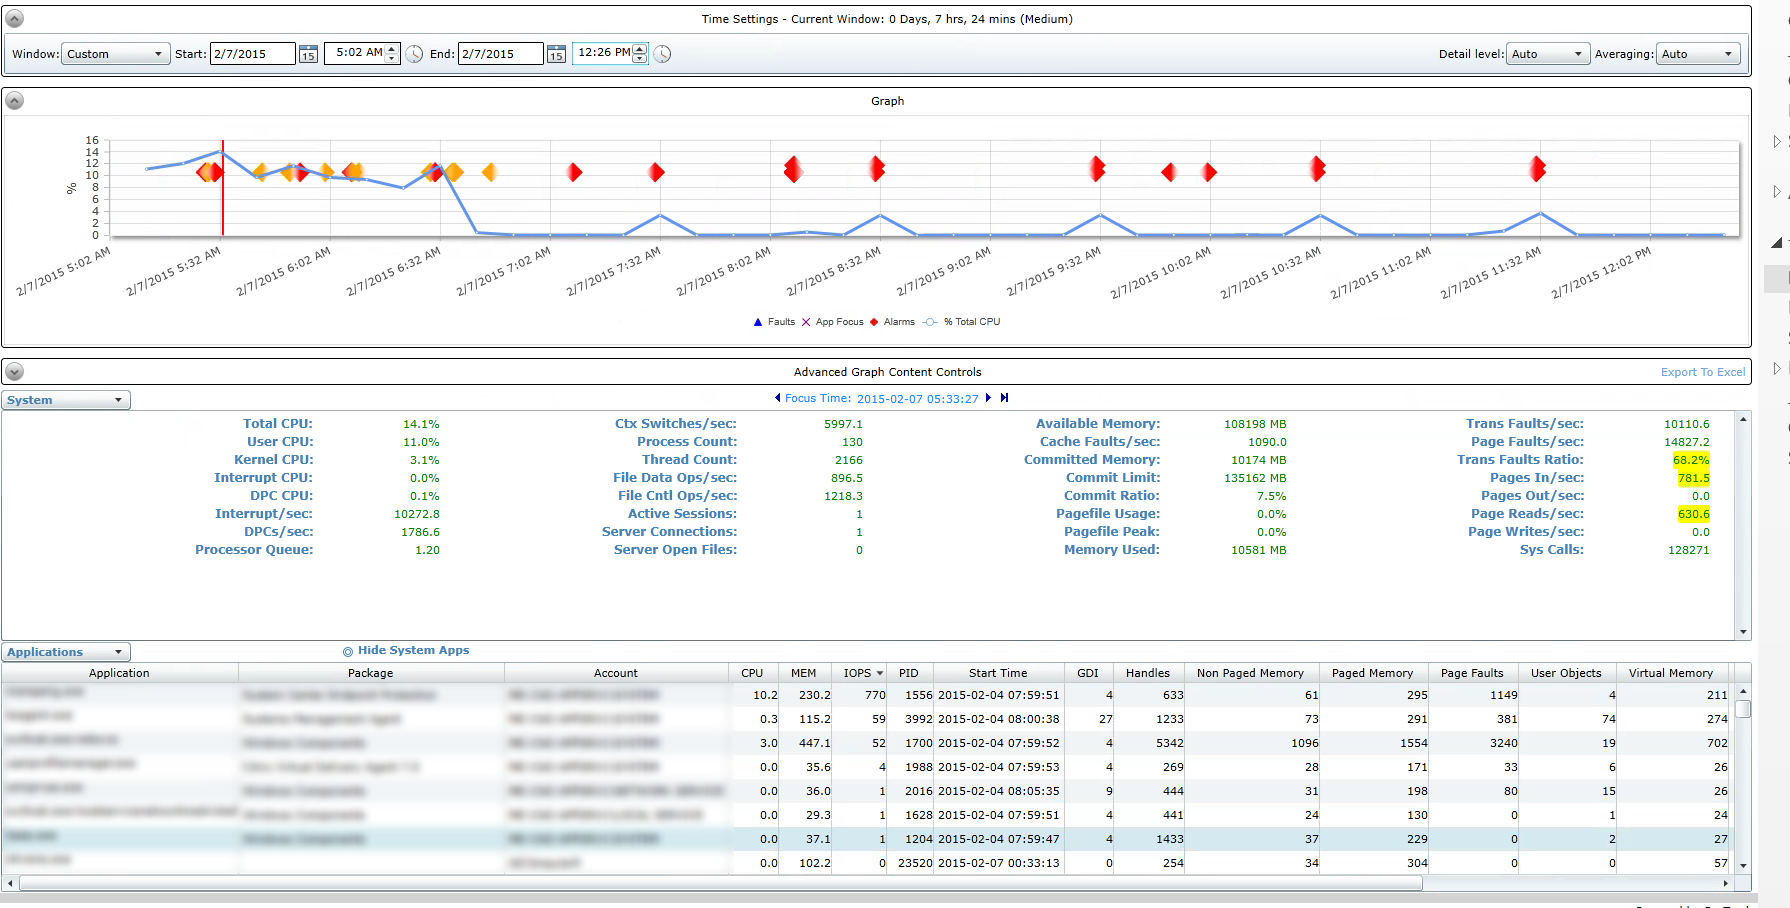
The storage performance counters just show one peak IOPS value that is related to read activity. A drill down into the SysTrack Black Box Data Recorder reveals more:

We have focused on the time of the read IOPS peak (07 FEB around 06:00A) and see that a particular system process is consuming a high number of IOPS. This correlates well with a high number of page reads per second and is overall consistent with the observations. In this particular case, it’s good that this system process is running at a time when the user density of the server is very low – a great validation of good IT practices.
In summary, this example shows a properly sized, well managed Citrix XenApp with NVIDIA GRID enabled HDX 3D PRO environment. The SysTrack toolset is the preferred managing and monitoring platform for many XenApp and XenDesktop environments. Data gathered from existing physical desktops and workstation can be leveraged by SysTrack to properly size and plan XenApp and XenDesktop farms to help in the transition and right-size the future environment. References:
- Funnies related to the good ole Fortran days: http://williambader.com/pentium.html#vms
- Blog post around Citrix XenApp and XenDesktop monitoring: https://www.lakesidesoftware.com/dashboard-citrix-xenapp-and-xendesktop-manager/
- Blog around GPU planning and optimization: https://www.lakesidesoftware.com/blog/lakeside-software-gtc-vgpu-planning-and-optimization/
- NVIDIA GRID: https://www.nvidia.com/object/enterprise-virtualization.html
- 20% off NVIDIA GTC registration: https://www.gputechconf.com/ Use my speaker code FF15S20
I hope to see you at this year’s GTC in March!
Florian
Subscribe to the Lakeside Newsletter
Receive platform tips, release updates, news and more


