The dashboard for the Citrix XenApp and XenDesktop Manager
Our SysTrack product collects a lot of invaluable data points across a potentially very large and diverse IT environment. Each individual system provides up to 10,000 data points every 15 seconds and the IT landscape can include everything from physical desktops and endpoints to a myriad of servers with various functions to the Citrix XenApp and XenDesktop environments.
Because of that broad diversity, it is sometimes important and desirable to boil down the data to the specific use case and area of interest for a key class of IT stakeholders.
The dashboard builder functionality that was first introduced in SysTrack 7.0 provides just such a facility. SysTrack users can create their own dashboards and even include data from a variety of non-SysTrack data sources (such as Citrix Director, but also other items like HR systems or software license management tools). In many cases, the construction of a meaningful dashboard requires good knowledge of the underlying data structures. Therefore, we at Lakeside develop dashboards and make them available at no additional cost to any of our customers through the dashboard builder functionality.
Dashboards for Citrix virtual apps and desktops
Today, I would like to introduce a series of very useful dashboards specifically targeted at the XenApp and XenDesktop administrators and stakeholders.
Here’s how they work:
First, as many of you know, SysTrack assigns a health score to each system or user session. It is expressed as a value between 0 and 100 and is an indication of the percent of time (measured in clock minutes) that the system is operating without resource limitations. We have a secret sauce algorithm internally that weighs the various factors depending on their severity; i.e. an application crash may weigh heavier than a temporary spike in CPU or disk utilization.
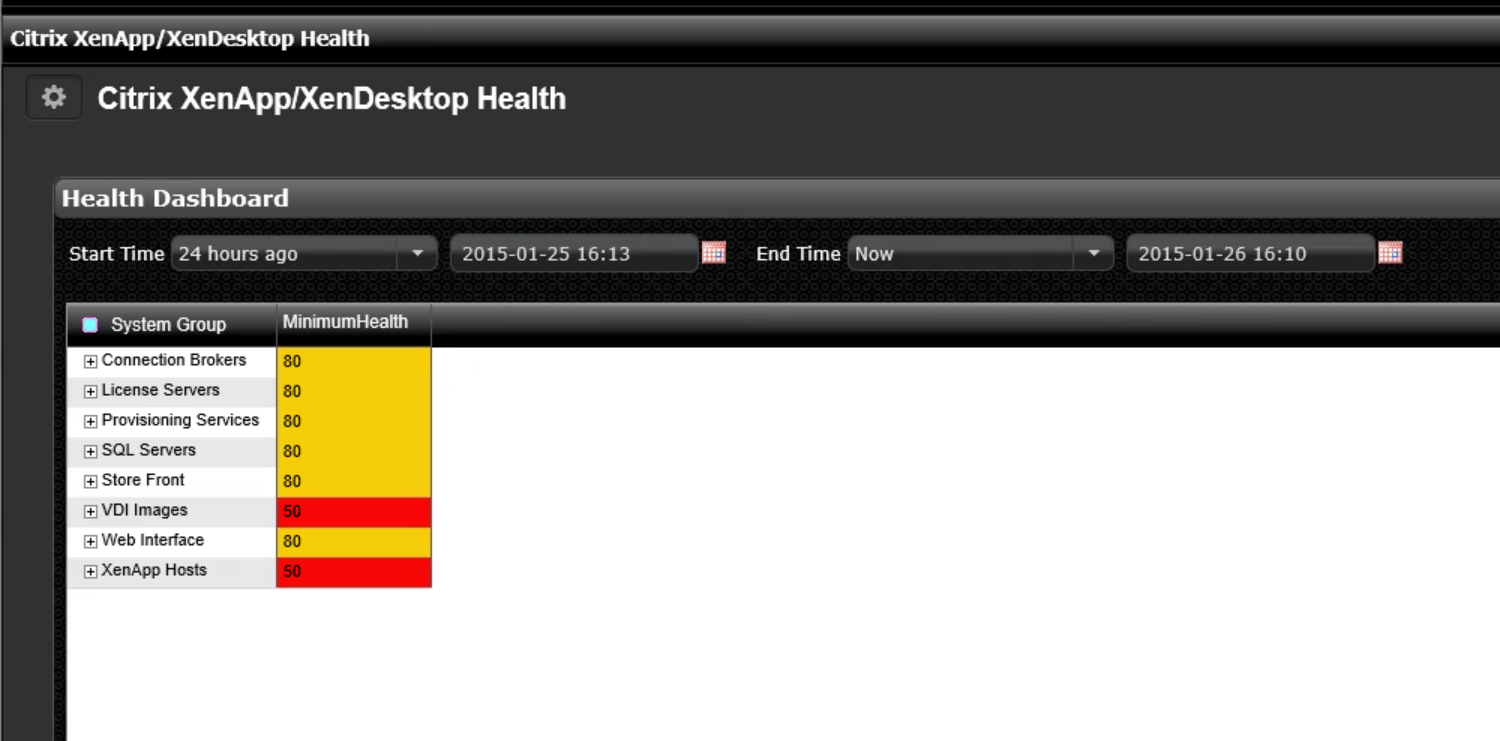
I took the health score as a starting point and provided a mechanism to group the relevant systems. For example, I would look at all the servers and images in each of the following categories:
-
Connection Broker
-
License Server
-
Provisioning Server
-
SQL Server
-
Store Front
-
Web Interface
-
VDI Images
-
XenApp Hosts
Each group can contain one of more systems depending on my environment. At first, I pick a time frame in the dashboard and it shows the lowest observed health score in each group. That gives me an idea in which area I might want to have an additional look.

In this case, it looks like my infrastructure servers are doing mostly fine, but at least one of my XenApp hosts experienced a health score of 50, which I am trying to investigate now.
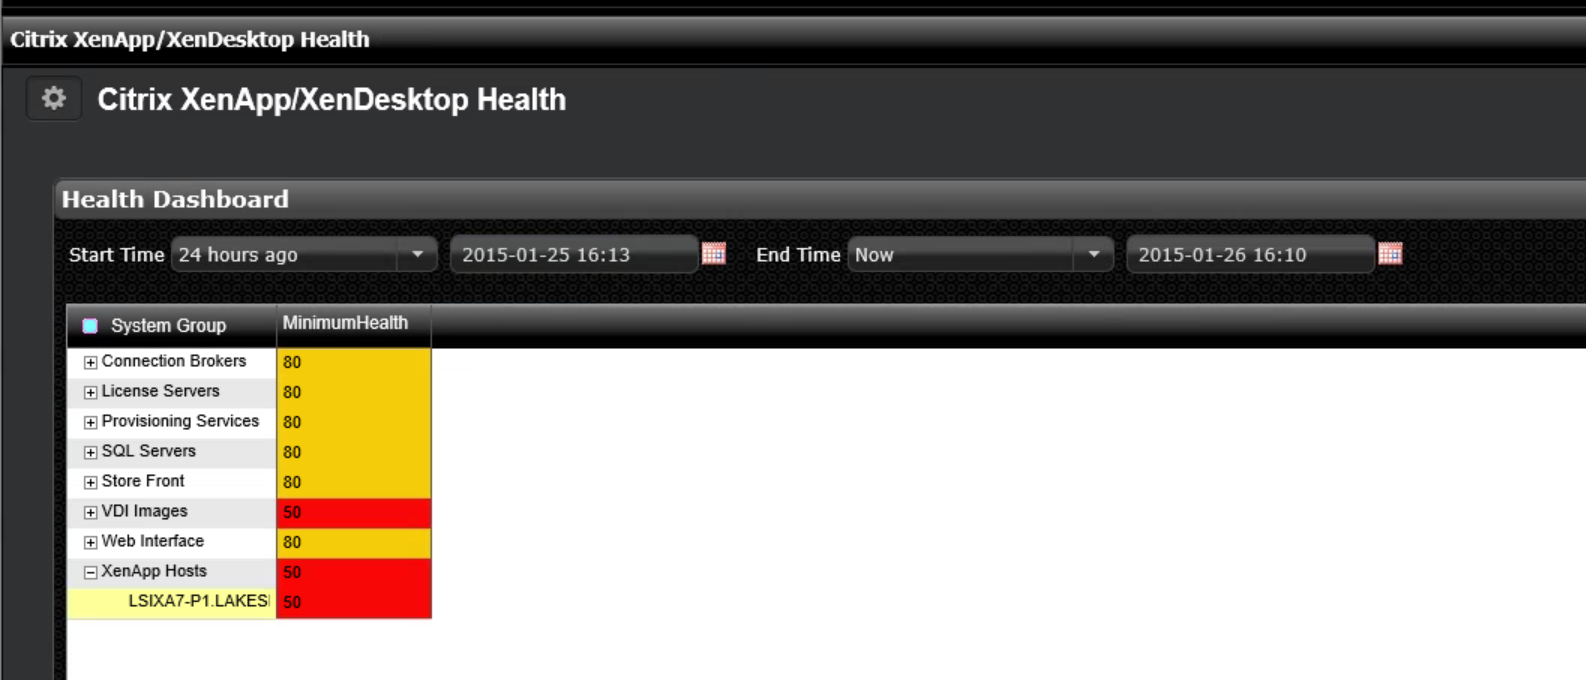
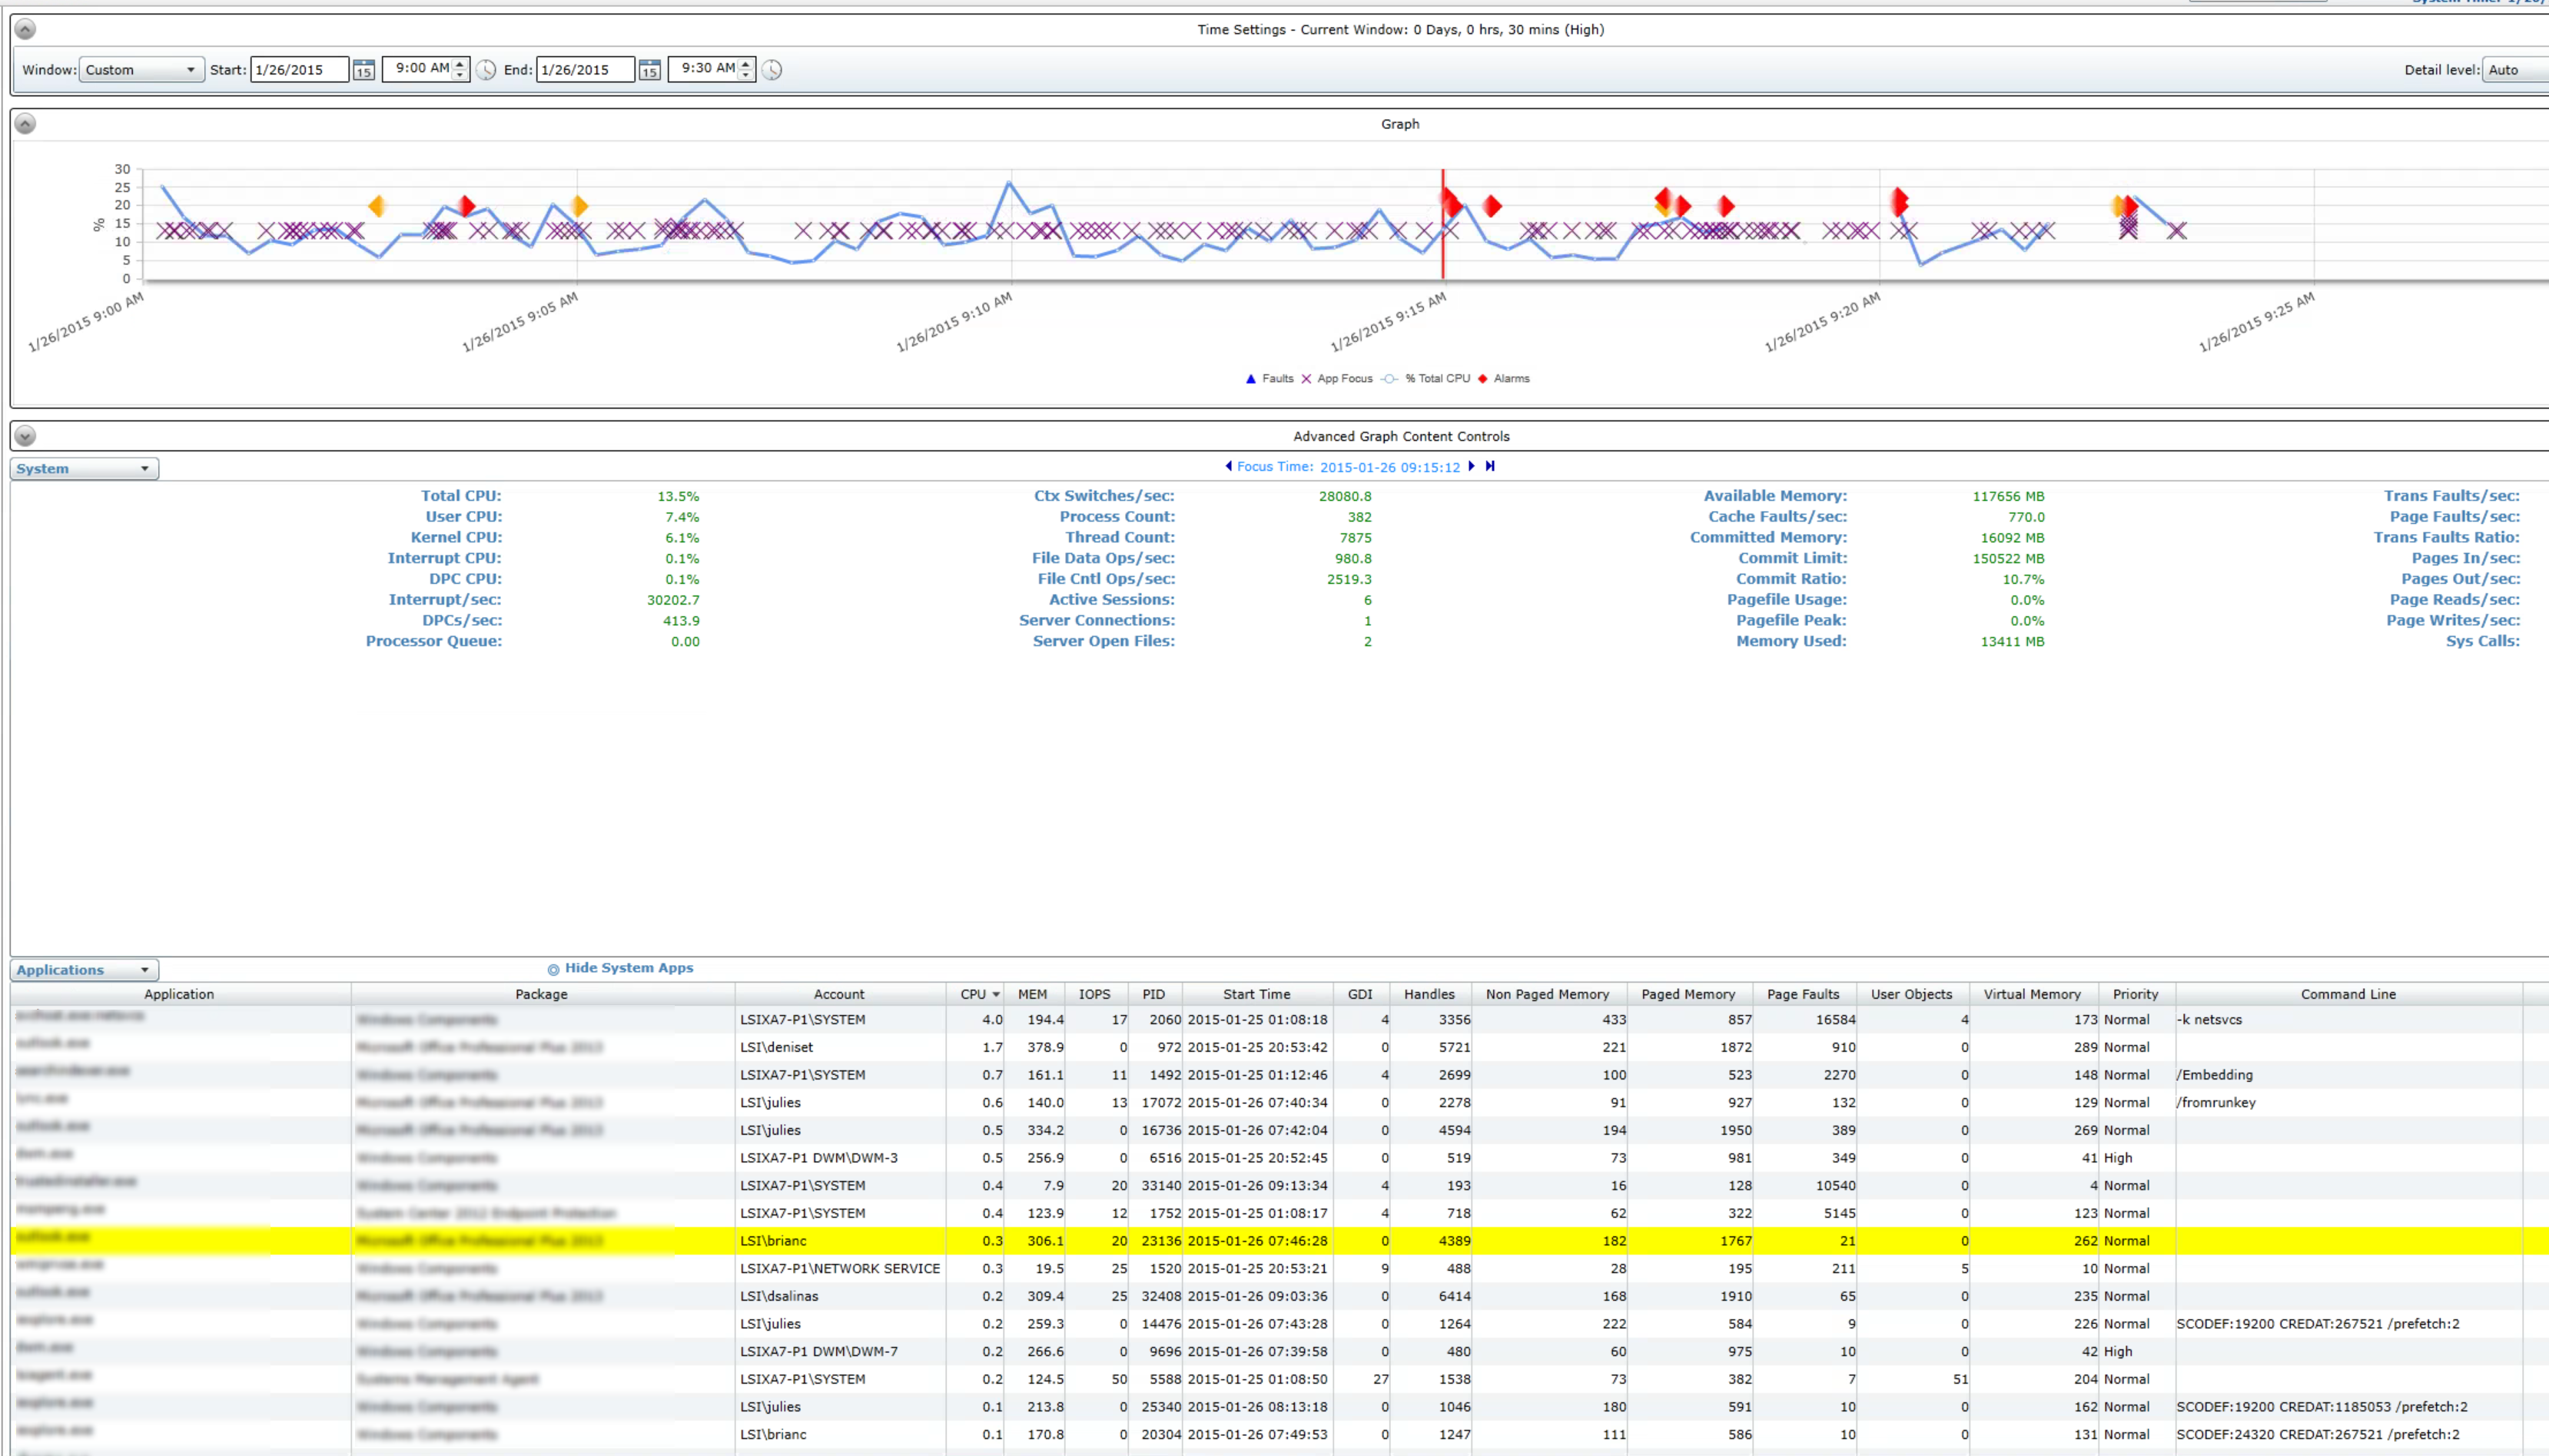
The expanded node shows the server with the potential issue and a double-click on the system name takes me into the next dashboard:
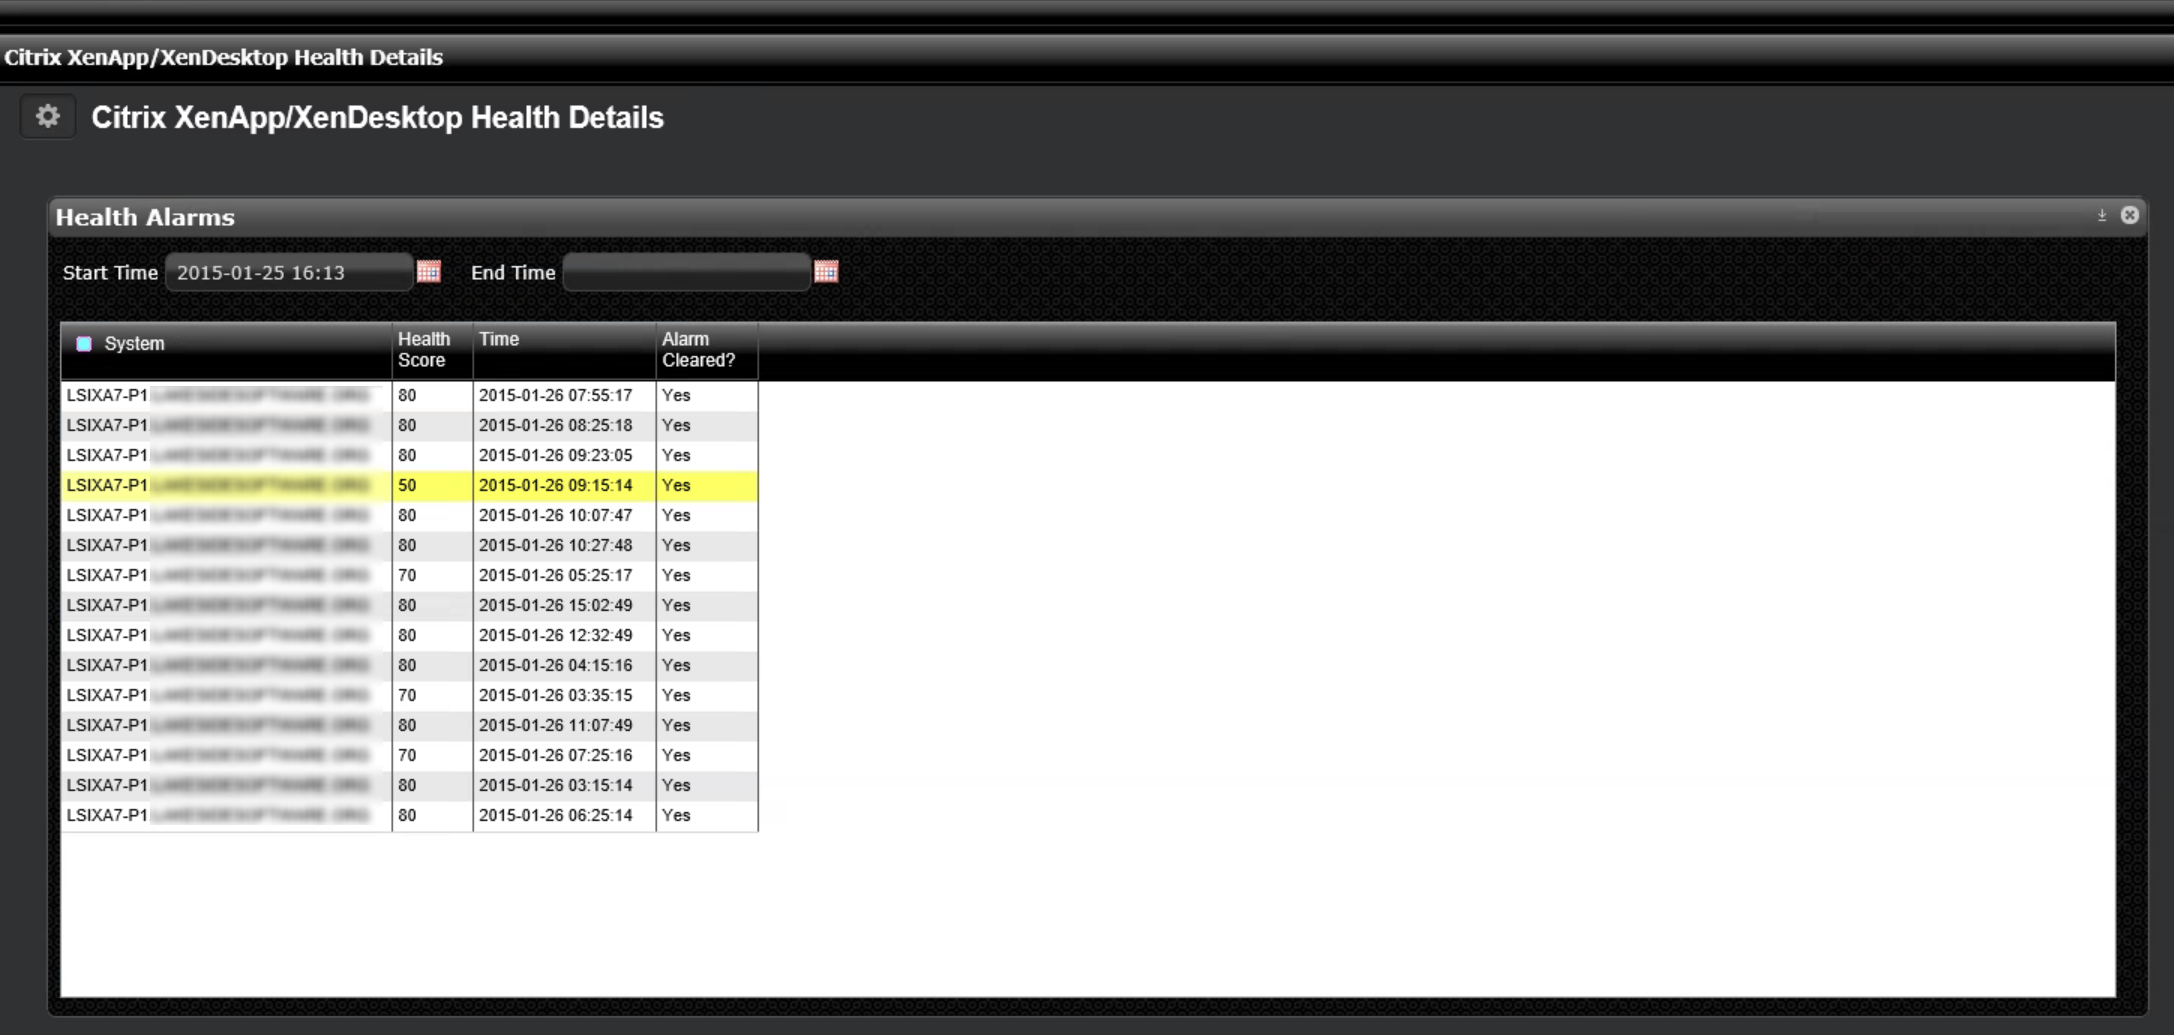
This view shows all the health alerts that indicate a reduced health score over the past 24 hours and I highlight the one with the score of 50. By doing so, the rest of the dashboard refreshes and shows only data that is time correlated to the time frame around that diminished health score – give or take a few minutes in each direction. The next pane in the dashboard now gives me a pretty good indication on where I need to focus my attention:

50% of the diminished health score was related to disk, 10% related to Event Logs and 40% related to application faults.
The rest of the dashboard has a number of detailed panes that I can use to get a better idea of what’s going on here. Let’s start with the Disk:
Application Disk details show all the running applications along with their disk related performance indicators:
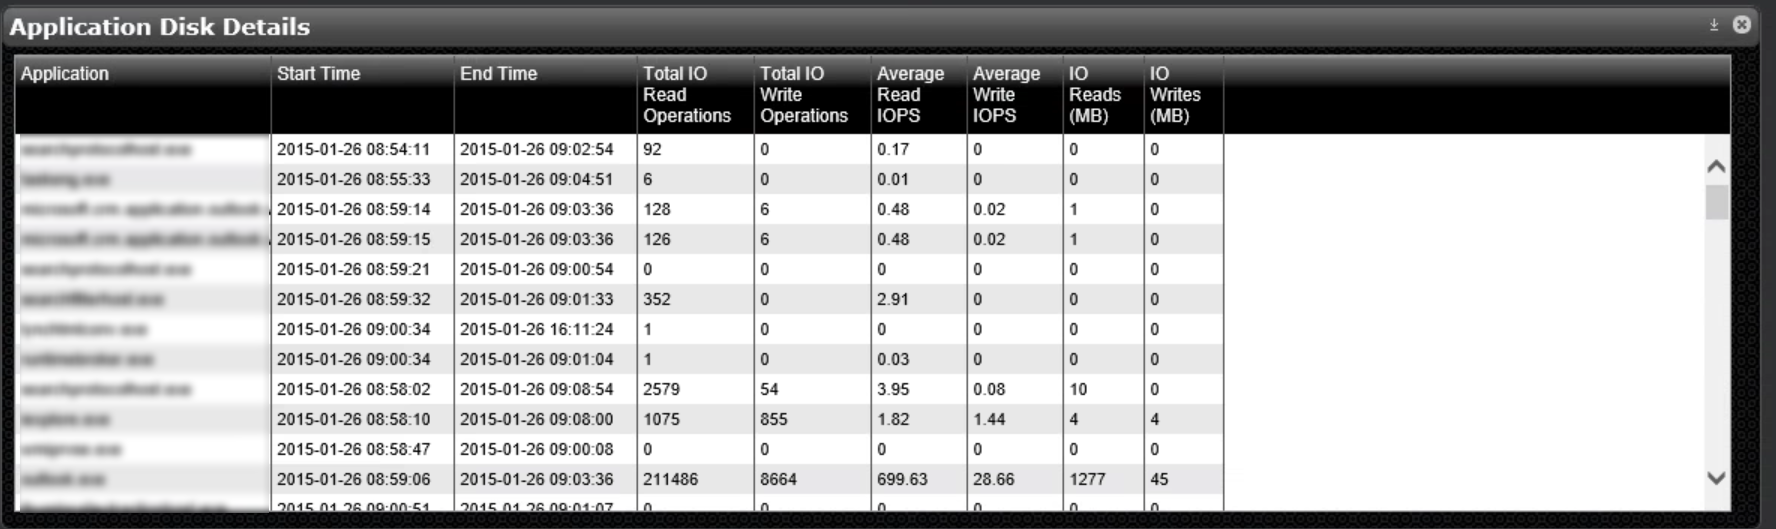
The one application towards the bottom sports almost 700 read IOPS, 29 write IOPS, and large number of total IO operations and data read from disk. Now, let’s have a look at the disk volume metrics:
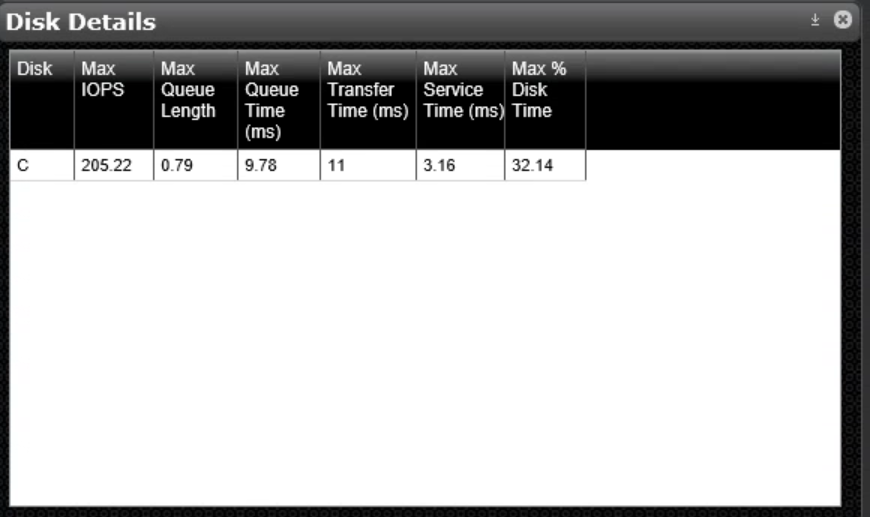
The C drive (which happens to be the only drive on this server) has a 32% disk time, indicating that the disk is not fast enough to deliver the IO load demanded by the applications.
Before we dig deeper into the disk topic, let’s have a quick look at application faults and the events:
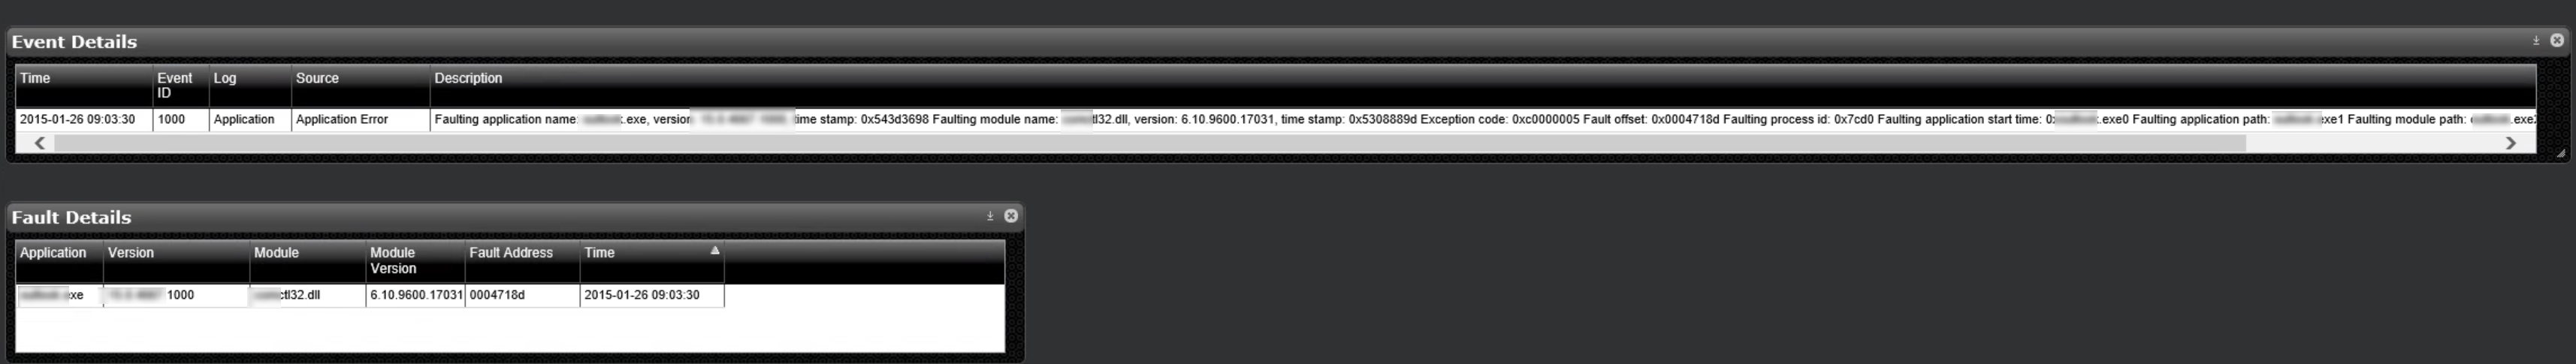
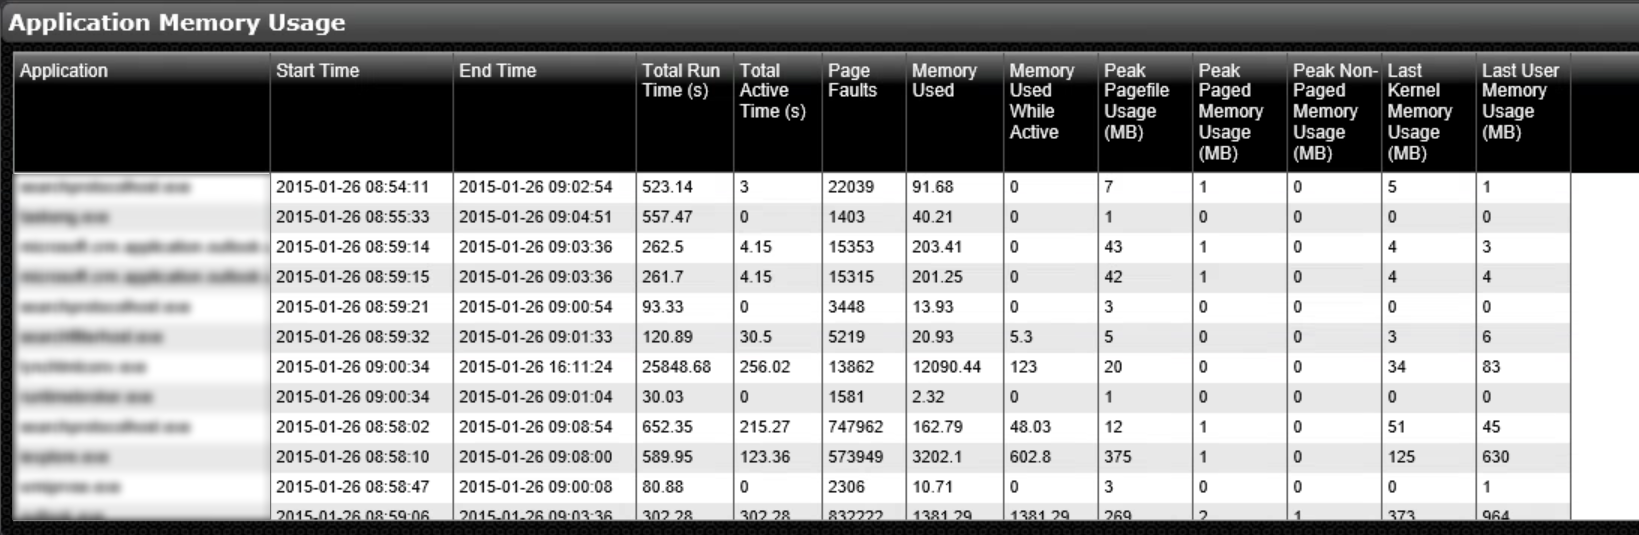
It looks like that this example shows a single application that is faulting, which in this particular case is also showing up in the events log. This may or may not be related to the disk topics we investigated earlier and we can now focus our investigation. The application memory list may show more relevant information:
I may also wish to look at additional panes on this dashboard that show virtualization impacts like CPU Ready Time or the effects of memory ballooning, network details, latency to user sessions or backend systems, and a slew of other metrics.
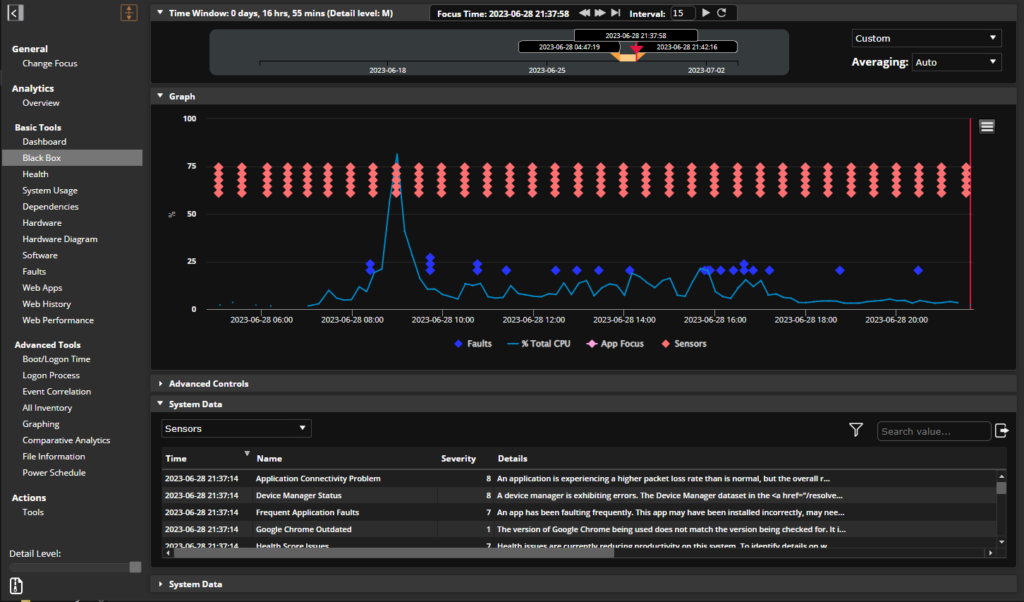
Alternatively, I can simply drill down into the black box data recorder by double clicking on the alarm that was shown at the very top. This brings me right to the specific server and the specific time frame:
From here I can see the general state of the XenApp Server, the applications that were in focus at the selected point in time, and a slew of other data to help me in the IT efforts. In this particular case, the disk state, application focus, and application faults all point to the same application that I can now investigate further and work with the vendor or the in-house development team to address.
To summarize:
- SysTrack provides a wealth of data about the infrastructure and the happenings from within the XenApp or XenDesktop workload, as well as from within the physical end-point. It can sometimes be daunting to focus on the pieces of information that are helpful for me in my specific role in the IT organization. I hear from Citrix administrators over and over again that their primary objective is to either show that “it is not Citrix”, or to resolve the problem quickly and efficiently and take steps to prevent a reoccurrence.
- The dashboards provide customers and partners the opportunity to create detailed visualizations that can be very specifically targeted at a job role, team, or function within the organization. SysTrack dashboards also integrate very easily with non-SysTrack data sources such as the Citrix Director database, ERP systems, HR systems, etc.
- This specific pair of Citrix XenApp/XenDesktop health dashboards is available to all SysTrack customers and partners via the download function in the Dashboard Builder.
- All health alarms described here can be disseminated to the right target audience in the organization via SNMP or email alerts in real time.
What ideas do you have? Please provide your feedback and comments!
Florian Becker
Twitter: @florianbecker


Subscribe to the Lakeside Newsletter
Receive platform tips, release updates, news and more