The proliferation of SaaS apps is changing the landscape of both how users do business and how IT supports them. You can find a great discussion about this topic in a post by Tal Klein. The basic gist of the post is that in the dark ages of computing, let’s say pre-2010, IT delivered the app to the user and hosted it within their own infrastructure, controlling all aspects of management and support. But as BYOD and mobile work styles picked up steam so too did the popularity of SaaS apps like Office 365. This movement was great for users, but at the same time has changed the way IT needs to think about its support model.
All of a sudden they went from controlling the backend and delivery of the app, which gave them visibility into causes of performance issues, to ceding that portion of management to the app vendor. This benefits IT by simplifying their app portfolio, reducing the number of apps they need to manage from front to back, freeing up infrastructure for other purposes, and shrinking the aspects of support for those apps to only how they impact users. Of course, IT will still be called upon by the user when there’s an issue with a SaaS app, but since the internal infrastructure is no longer hosting the app then what’s left? The user is now the only real place to get valuable information as it relates to supporting SaaS apps.
SysTrack has always put a strong emphasis on end-user computing with features like system health scoring and point-in-time looks at historical data. IT will have the visibility it needs to understand what’s going on with the user’s systems and what the causes are for performance issues. SysTrack’s unique “inside-out” view provides insight into what the end user is experiencing and provides tools to assist with diagnosing issues that may be impacting their performance. With that in mind here’s a few questions SysTrack can help you answer as you’re supporting Office 365 users.
How many Office 365 Users are there?
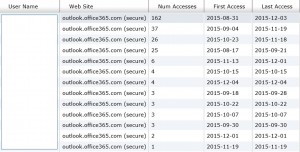
Even seemingly simple questions like this aren’t as straightforward to answer as you might think. With Office 365 being accessed through a web browser you’ll need data on what users are visiting what URL’s. In the Observations area of Site Visualizer you can open the Popular Web Sites dataset and filter the results to show only Office 365 data. Here you’ll get some great basic data including number of users, number of systems, number of times accessed, first and last access dates, page load time, time page was open, and page focus time. This high-level data illustrates the scope of users and systems you need to support. If you’re interested in which users or systems in particular are included in this data simply right-click on the column you’re interested in, number of users, for example, and select show details. A detailed information box will pop up showing you user accounts, number of times accessed, and first and last use dates.

In addition to web applications you might also use the same method to find information on the Office 2016 Windows client software that gets downloaded to the user’s system. Check out the Applications or Software Packages datasets to find out usage information and aggregate resource consumption.
Is User Experience Impacted by Office 365?
While there are a lot of factors that go into the user’s Health score, 13 categories in fact, it is a very powerful way to gauge the general experience of the user. I find it especially helpful to judge the impact of a big change in the environment. Maybe the user just migrated to Windows 10, or maybe a VDI user was just migrated to a different storage system – take a look at how that system’s Health has trended from before the change to after. In this case, maybe your entire user base just adopted Office 365 for Outlook and Office online. That’s quite a big change since these are such widely used tools in everyday business. Enterprise Visualizer allows you trend the aggregate Health score across the entire environment to give you a quick idea of whether that change has had positive impact or sent your user’s experience in a downward trend.

If you’re interested in only a certain group of users or even an individual user you have the ability to trend Health for those scenarios as well. Site Visualizer is great for filtering data to a specific set of users while Resolve allows you to target an individual user. You also have the ability to view the trend over a custom time frame. One last important thing to note about viewing Health score trends is that you can look at the impact from a specific factor – maybe you’re only interested in seeing what the trend has been for Network Impact or Latency Impact as it relates to a surge in browser usage with more users accessing online apps. An increase in network activity would be expected since the backend is no longer on premises.
What’s going on with the User’s System?
Answering questions about what caused slow performance or a system crash can be very tricky, especially when the event happened sometime in the past. SysTrack Resolve is perfect for this as it connects directly to a system of interest and allows you to view any point in time and see which apps were running, what the resource consumption looked like, and much more for that exact time. If a user is telling you that this morning around 9:30 their system was crawling and they weren’t able to access their Office 365 Outlook account you could check out Resolve Black Box to investigate what the culprit was. The screenshot below is a simple illustration of what you might find.
![]()
There was a local app consuming about half of the available CPU. It is very likely this was the cause of the slow performance that was preventing the user from being able to access their email, the entire system was being slowed due to this app. This kind of insight directly into the user’s system is critical in being able to find out what’s causing performance issues, what events occurred that could be of interest, what the latency has looked like in the past, and all other kinds of extremely relevant data.
The market is rapidly moving more and more towards SaaS and cloud computing in general. This means it’s more important than ever to retain some level of visibility into the environment, but with more and more of the apps a user interacts with coming from outside of IT’s borders, you need the visibility to come directly from the user, an “inside-out” view. SysTrack is evolving right along with this market shift to make sure you can always have the data you need to keep your environment running smooth.


Subscribe to the Lakeside Newsletter
Receive platform tips, release updates, news and more