Sizing VDI is a balancing act between end-user experience and infrastructure costs. Further complicating the task is the fact that software and user needs evolve over time, typically in ways that demand more resources and a higher quality experience. To keep up with these changes and ensure that both productivity and density are optimized, VDI admins need tools capable of accurately assessing current user experience and pinpointing the root cause of poor virtual desktop performance.
NVIDIA nVector is a benchmarking tool designed to provide insight on the quality of virtual desktop user experience. The unique NVIDIA approach focuses on the experience of the user on the endpoint device rather than the response time on the virtual desktop. This focus on the end user’s perspective allows admins to better understand how fast and smooth the experience feels for the user, as well as image quality. These nuances go a long way to making the VDI user experience closer to a native Windows OS.
In this post, we will further explore what nVector is, why VDI user experience matters, and how to get—and stay—ahead of VDI performance problems with the help of benchmarking and analytics.
What Is NVIDIA nVector?
NVIDIA nVector is a performance benchmarking tool for VDI that simulates end-user workflows and captures end-user latency, framerate, and image quality metrics. These metrics can help admins understand the quality of a user’s experience as they perform tasks on a virtual desktop.
Here’s what is measured by each metric:
- End-user latency – The end-user latency metric captures lag at the endpoint when interacting with a remote desktop or app. It can help a VDI admin understand the responsiveness of the remote desktop or app (i.e. how “slow” it feels for the user).
- Framerate – Framerate measures the rate at which frames are delivered on an endpoint device’s screen. This metric tells IT how smooth or choppy the user experience is.
- Image quality – Imagine the difference between watching a video in 480p versus 4k. This metric measures the impact of remoting on image quality. It is determined using Structural Similarity Index (SSIM), which quantifies image quality degradation by measuring the difference between two images. NVIDIA nVector applies this method by comparing a frame rendered on the target VM with the frame shown to the end user.
Why Benchmark VDI User Experience?
Understanding and improving end-user experience has many business benefits, from boosting employee productivity to helping IT identify opportunities to reduce costs. The first step to unlocking these benefits is achieving a full and accurate picture of the current state of user experience in your environment. Tools like nVector that measure user experience at the endpoint are useful for providing a view of how real users perceive their desktop experiences.
Benefits of a positive VDI user experience include the following:
- Increased productivity as a user navigates the desktop faster and more easily
- Better acceptance of VDI as users’ impressions of virtual desktops improve
- Improved graphics for users with high-resolution monitors and multiple monitors
- Better application performance, particularly for resource-intensive software such as video and image editing programs
- Increased number of application features that can be used as sufficient resources are allocated
- Fewer support tickets logged
- Better VDI scalability, as users with high user experience needs can potentially be migrated to virtual desktops
Providing virtual desktop users with enough resources to support their needs isn’t only important for users whose critical applications consist of tools like CAD and Photoshop. Our own analysis of customer data indicated a 30% increase in graphics needs from Windows 7 to Windows 10. As businesses continue to migrate users to Windows 10 and modern applications like Office 365, the ability to understand and systematically manage end-user experience will be paramount.
| Office App | Average of Windows 10 | Average of Windows 7 | Percentage Increase |
|---|---|---|---|
| Excel | 4.62% | 3.02% |
52.88% |
| Outlook | 16.34% | 8.85% | 84.65% |
| PowerPoint | 5.45% | 3.33% | 63.64% |
| Skype for Business | 11.97% | 2.35% | 408.99% |
| Visio | 3.67% | 1.18% | 211.56% |
| Word | 4.57% | 4.35% | 5.24% |
Office Application Percentage of Time Consuming GPU (DirectX or OpenGL)
Investigating Causes of Poor VDI User Experience
When using NVIDIA nVector to benchmark end-user latency, framerate, and image quality, VDI admins may discover suboptimal remote desktop and application performance. If this happens, root cause analysis tools for VDI are a logical next step to discover the issues behind the performance problems so that they can be addressed.
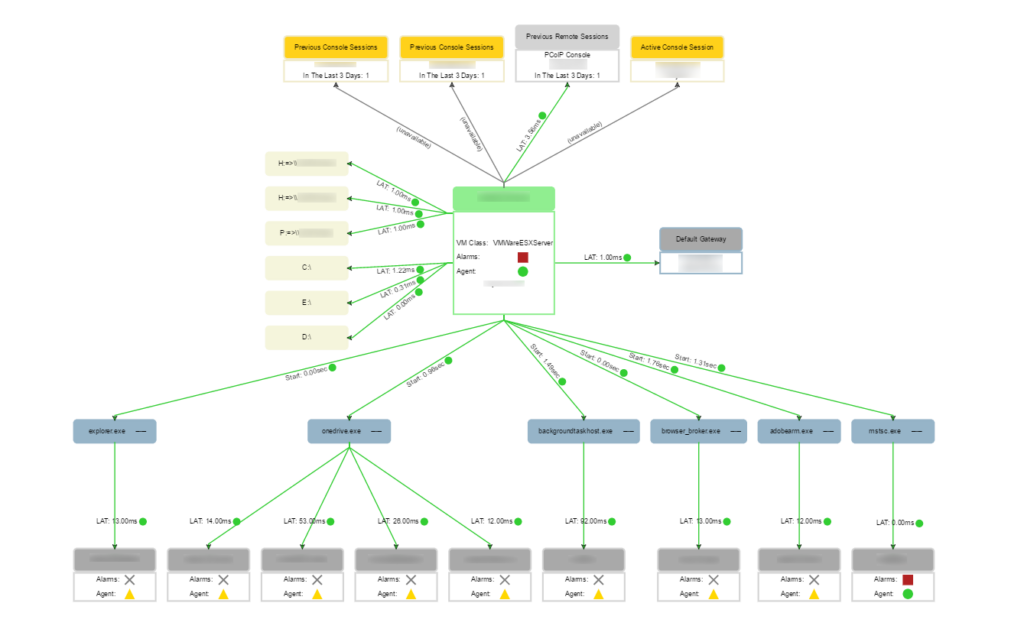
SysTrack, Lakeside’s digital experience monitoring platform, provides detailed forensic data for physical and virtual endpoints that helps IT teams pinpoint and resolve the root cause of problems impacting end-user productivity.
For example, if a user is experience high latency, what factors are contributing to the slowdown? SysTrack captures over 10,000 data points every 15 seconds including KPIs like CPU, disk, memory, network usage, and more. IT can investigate endpoints using this data to identify the root cause of the problem and prevent it from reoccurring.
Together, SysTrack and nVector help you understand VDI user experience, troubleshoot and resolve problems, and make sizing decisions based on real user needs.
How to Get Started
To learn more about nVector, read NVIDIA’s launch announcement.


Subscribe to Lakeside Updates
Receive product updates, DEX news, and more