Digital Experience Management and Event Correlation with SysTrack
SysTrack provides the ability to score an environment’s end user experience using digital experience management metrics. The resulting end user experience score provides a clear view of the end user’s experience in that environment and is composed by a series of Key Performance Indicators (KPIs). These KPIs are structured to provide direction to any problems in the environment that may affect the end user. The key to the philosophical approach with SysTrack, though, is the joining of this scoring to event correlation and analysis through the use of proactive alerts. These proactive alerts tie that overarching score to triggered, targeted events to provide a fuller and easier to understand portrait of the IT environment.
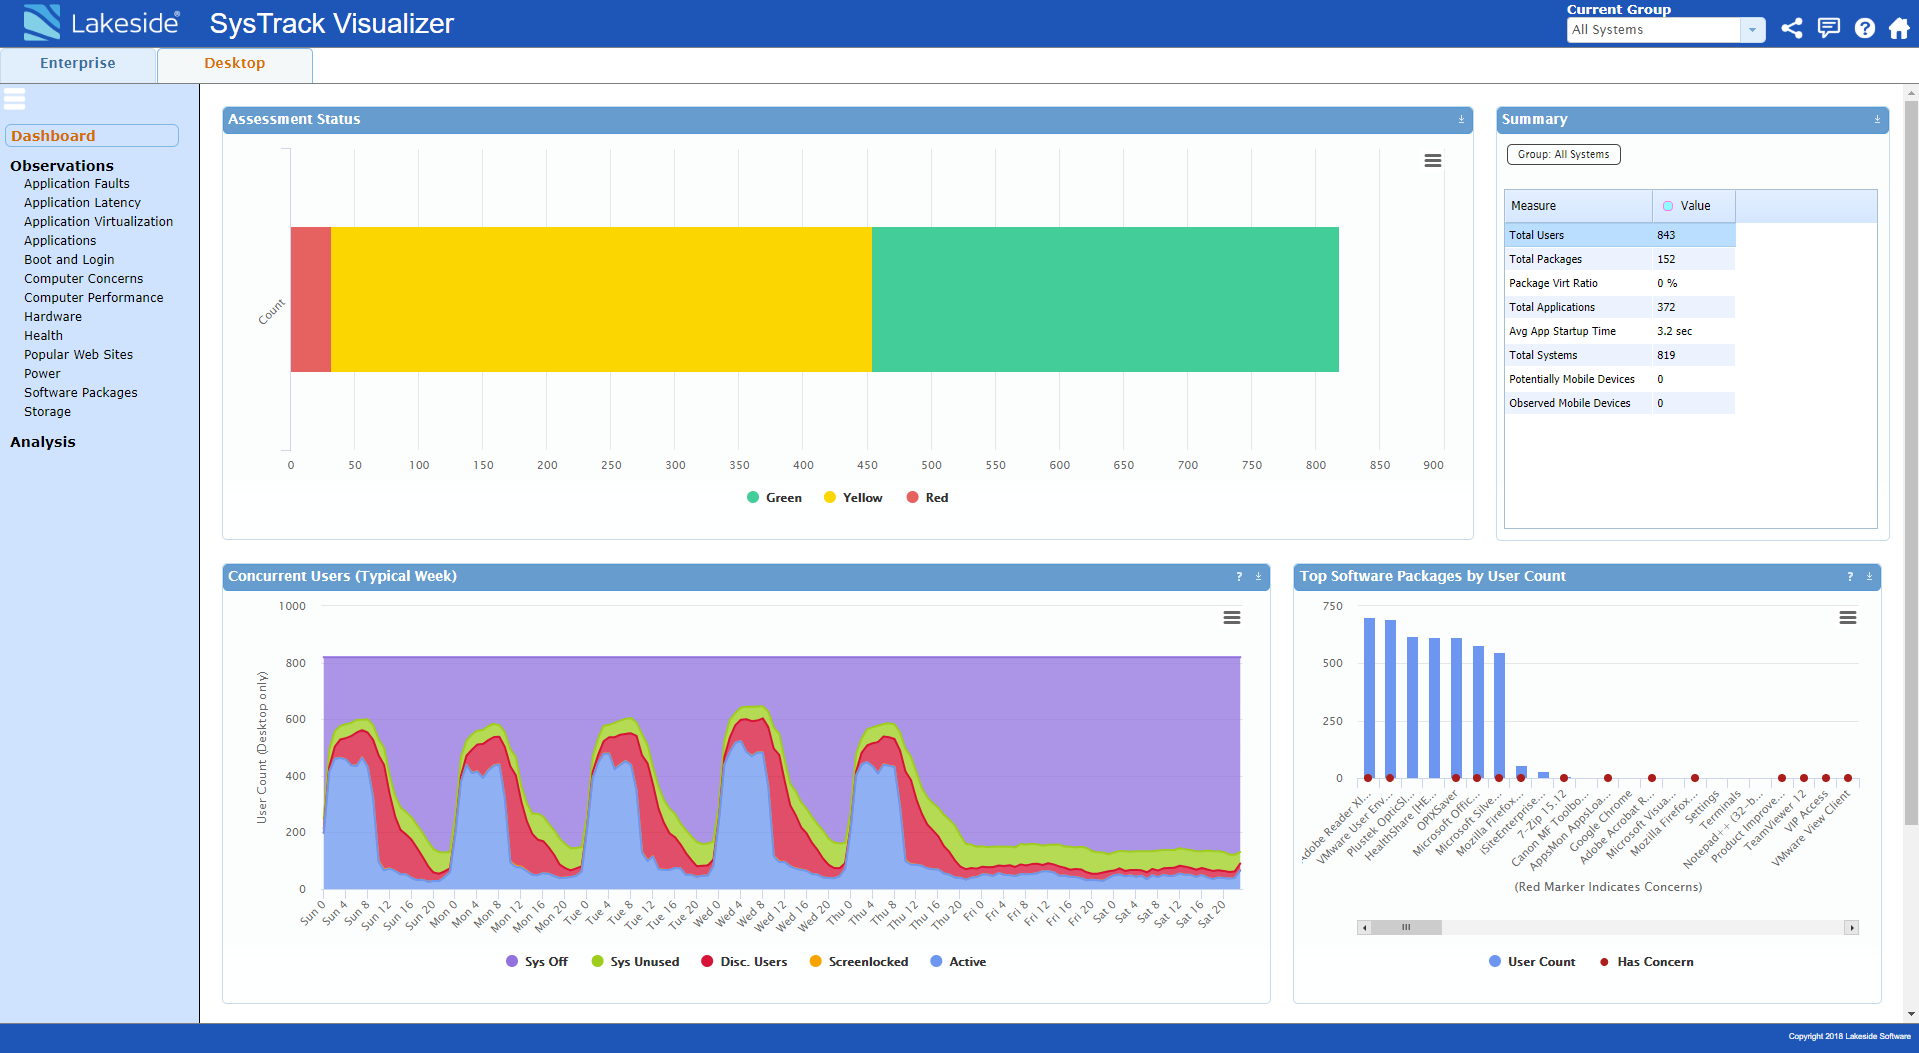
 This starts with our end user experience score, and it’s best thought of as a simple grade. Basically, the score comes in a range of 0 to 100, with a score of a 100 implying the environment is providing the best end user experience. The score is composed of 13 different KPIs that represent aggregate data points on potential sources of impact. These roughly fall into the categories of resource issues, networking problems, system configuration issues, and infrastructure problems. This results in a great, normalized score to understand across a broad set of different systems what kind of performance issues are occurring. Even more importantly, it provides a platform for long-term analysis for trending to see the trajectory and evolution of that experience over time. The image below displays an overall view of the end user’s experience of the environment and the ability to monitor the evolution of those impacts over time.
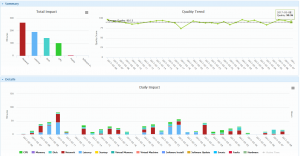
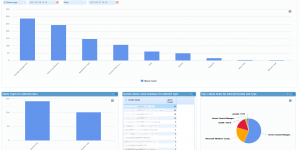
For more operational items that require an immediate response the alerting mechanism comes into play. Alerts are an active component that are triggered by events generally correlated with negative impact. Alert items roughly correlate with the end user experience score KPIs to help further IT administrators’ direction towards resolving problems. The image below demonstrates an environment with active alerts.
 The key piece is correlating these items to that impact in a meaningful way. So, the big question is this: how do they work with one another?
One of the most common ways alerts and user experience scores are used in conjunction is through a feedback loop. An administrator determines which KPI is causing the largest source of impact and continues to drill down providing a clear view of placed and potentially triggered correlating alerts. The alerts will direct the administrator towards the underlying causes of the problem and finally to the potential source of impact. After the resolution the administrator can track the increase in user experience as a result of their improvements to see how successful their changes have been.
End user experience scores provide an overall indicator of the quality end users are experiencing, while alerts provide immediate information on the source of impact. The integration of both tools provides an easy and clear way for IT administrators to discover the source of a system’s impact. To learn more on this topic check out our white paper, Utilizing KPIs and Alarm Methods!


Subscribe to Lakeside Updates
Receive product updates, DEX news, and more