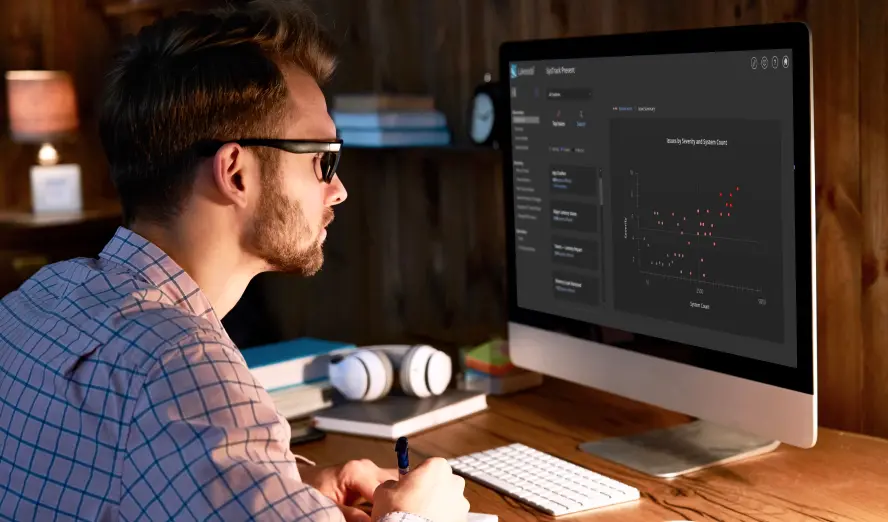

The evolution of IT has necessitated changes to the model for organizations looking to understand the state of their end users’ experiences. With that in mind, Lakeside has developed three new ways of gaining visibility into the IT environment that are available in our latest release, SysTrack 8.3.
At Lakeside, we talk a lot about the importance of getting data at the source: end-user devices. Twenty years of experience working with IT Pros has shown us time and time again that endpoint monitoring provides the most objective and actionable data for IT.
While the endpoint is still at the heart of SysTrack, we’ve also come to recognize the value of having access to additional information beyond observable, quantitative metrics that come from real end user data. Subjective user experiences, artificial transactions, and industry comparisons can also play a role in rounding out understanding of the end-user experience and establishing performance baselines.
Experience Feedback – Intelligent Questioning and Reporting
One of the strongest parts of the SysTrack workspace analytics platform is the ability to collect a quantitative user experience score to give IT a more objective view of their supported systems. However, we’ve spoken about how end users are people with distinct needs and views on their IT experiences, and overwhelmingly we’ve gotten feedback that IT organizations are very interested in those subjective views. This led us to combine the quantitative with the qualitative using SysTrack’s Experience Feedback capability.
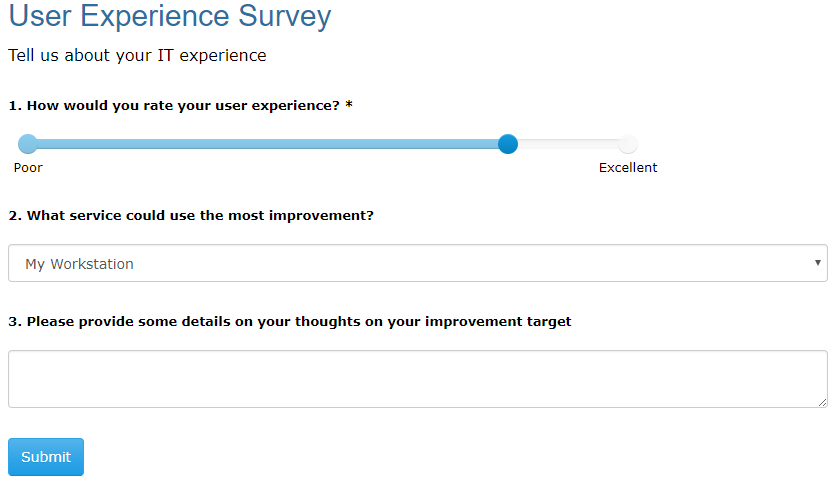
The basic idea is to provide IT with a set of default surveys, and an intuitive builder to create more, that can be intelligently sent out for users to fill out at massive scale. Even better, they can be configured to only trigger under certain conditions. Interested in getting feedback from users that have a lower user experience score? Surveys can be customized to only go out to users that experience lower quantitative experience scores or be triggered on scores dropping. Interested in the opinion of early adopters of a software package? Customized rules that send out questions specifically targeting users of specific packages or versions can be sent out to gather that feedback from users that have interacted with them. Through this mechanism, IT can get the final piece of the puzzle: the opinions and thoughts of the end users.
Lakeside received a Best of VMworld 2017 award in the End-User Computing, Mobility and Desktop Virtualization category for our survey feature. Here’s what the TechTarget judges had to say: “Surveying users for opinions of their experience, then correlating that with empirical performance data gathered by their agent allows IT to fine-tune resource allocation and better understand end users’ needs.”
Synthetic Toolkit – A Framework for Automation
With the massive increase in the prevalence of synthetic transaction based testing, it’s clear that IT organizations see real value in continuously driving artificial workloads against their critical IT services and platforms. This can be a great way to find out if certain applications or systems are experiencing increased load times or general performance problems, but it leaves one key question: why is it that things are running slower than I’d expect? SysTrack’s detailed system metrics provide an obvious complement to this.
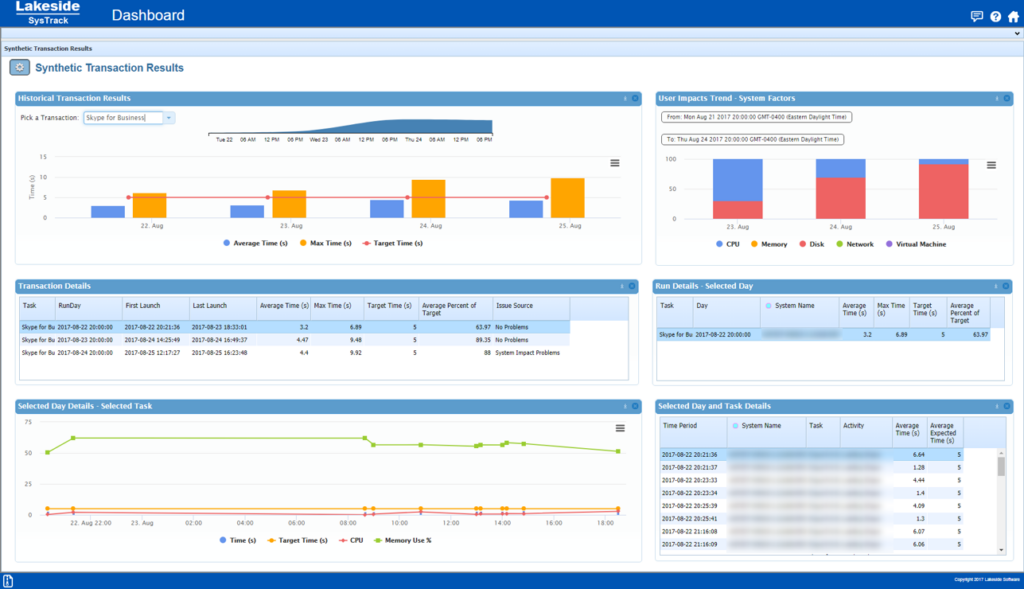
SysTrack 8.3’s Synthetic Toolkit provides an organization a scalable, native mechanism to leverage any existing synthetic transaction toolset with SysTrack. Through the simple toolkit integration, any organization can marry the detailed performance metrics associated with SysTrack with the transaction timing from a synthetic transaction tool. This results in an easy method to run robotic workloads against key services with an inbuilt reporting mechanism to discover the underlying causes for slowness. From here, the IT organization can really get at the underlying root causes behind any issues, and use their proactive notification of issues to greatly reduce their resolution times.
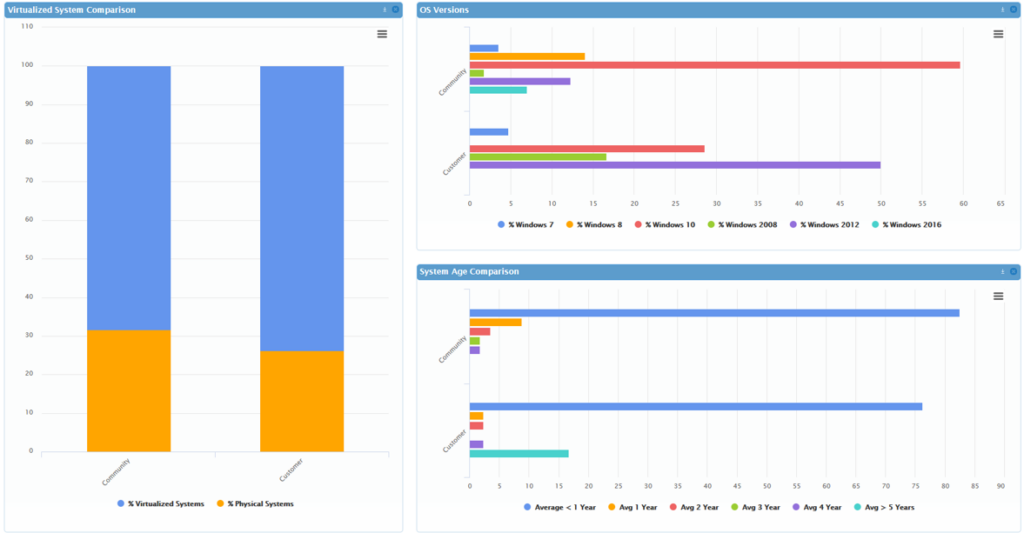
Community Visualization in SysTrack 8.3 – Learning from Your Industry
IT environments are closed ecosystems, and for good reason: detailed data can contain sensitive information about employees and operations. However, comparing IT environments from organizations within the same industry can be immensely useful for understanding how an environment stacks up in terms of overall performance and key technologies.
SysTrack Community gives IT access to anonymized data from outside of their organization, allowing IT to not only measure their success against themselves, but also against industry averages. New in SysTrack 8.3, customers who opt in to SysTrack Community will have access to a Community view within SysTrack Visualizer. This view makes it easy for IT organizations to compare their environment to other organizations in the same industry.
Beyond helping to shape an idea of baseline standards, community data can also be useful for budget rationalization. If organizations in the community are running newer hardware and software, IT can use that information to help make the case for upgrades. As IT plays such a large role in enabling employee productivity and business growth, having visibility into external data provides an extra edge over competitors.
In weeks to come, we’ll cover these features in greater detail along with other new features available in SysTrack 8.3.


Subscribe to Lakeside Updates
Receive product updates, DEX news, and more