
Citrix XenApp Session Monitoring
At Lakeside Software, we’re all about the end-user computing experience and our SysTrack product is well known to instrument desktops and servers across the physical and virtual world.
We realize that each use case and environment is different and that customers often like to have information readily available that is relevant to their specific environment and to their individual job. In the case of Citrix XenApp and XenDesktop, we recently published a paper that outlines some general best practices and walks readers through the various areas of SysTrack that are relevant to this use case.
For best practices regarding XenApp monitoring right out of the box:
http://portal.www.lakesidesoftware.com/support/Monitoring_Citrix_XenApp.aspx
Steps to XenApp monitoring
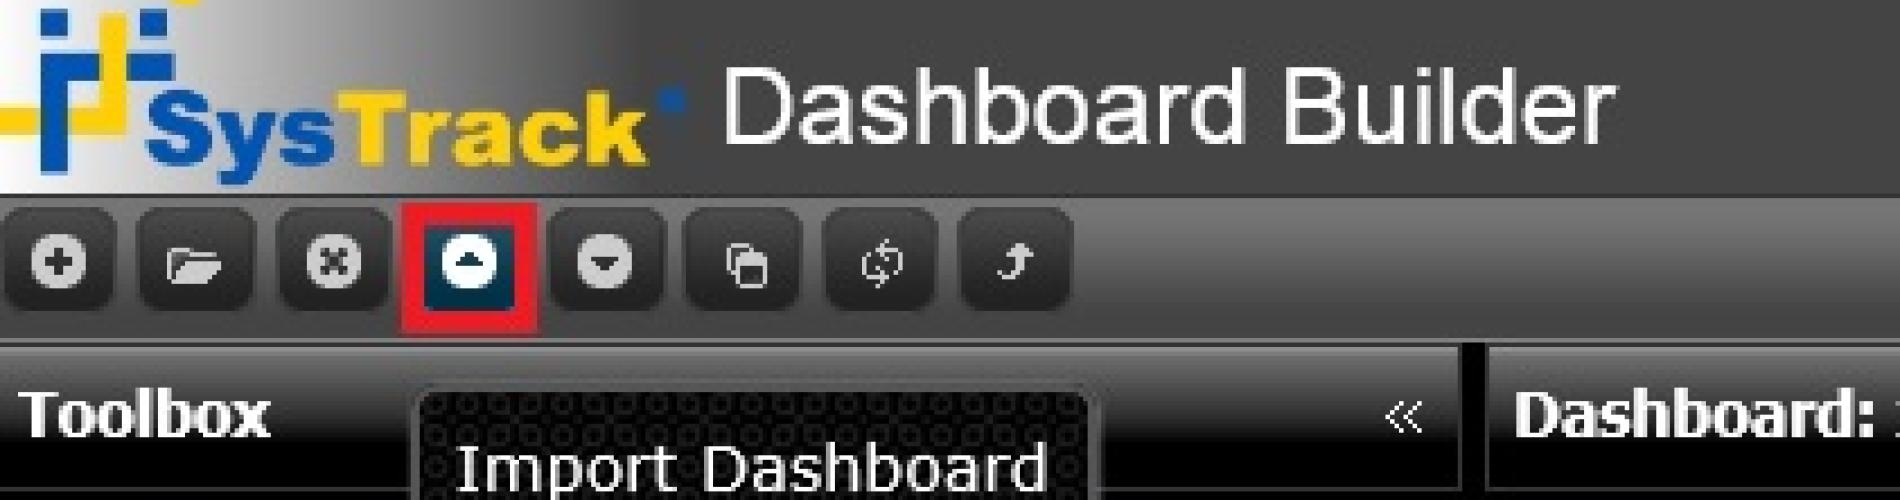
Today, I am excited to introduce another example of how SysTrack supports Citrix XenApp and XenDesktop environments in a very powerful way through the Dashboard Builder, which ships with SysTrack 7.0 and later. The dashboard configuration discussed here is available for download from our servers through the dashboard builder tool in the product:
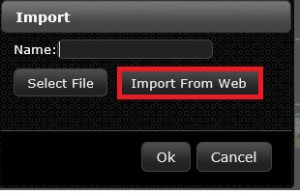
Then select the Import from Web option and select the Citrix XenApp Sessions dashboard. Here’s what it does:
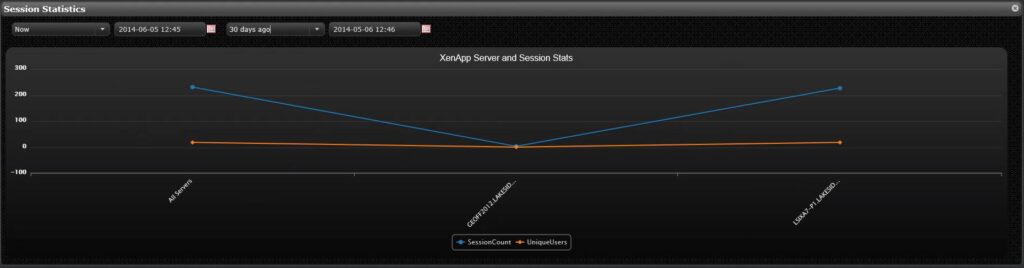
- First, select a time frame of interest. The default is the last 7 days, but any time scale can be selected
- The first graph shows the number of sessions and number of unique users on each individual XenApp server, as well as the total across all servers:
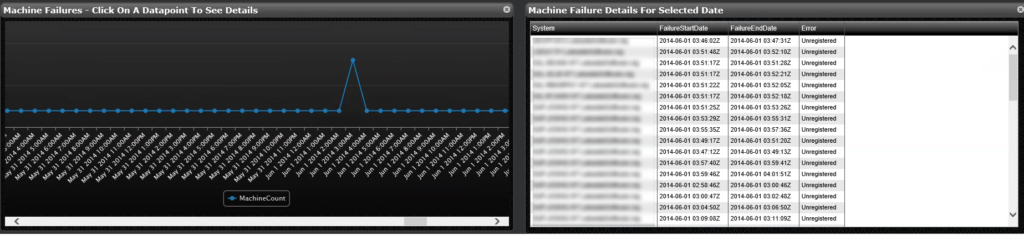
- The second pane is interesting because it shows data that is actually being pulled out of the Citrix Director / EdgeSight data set. It shows the number of machine failures across the selected time frame as a line graph. Clicking on any of the data points reveals a complete list of machine failures for the time interval that is associated with the data point (A machine failure in this context is a failure to register with the Desktop Controller, being stuck on boot, etc. )
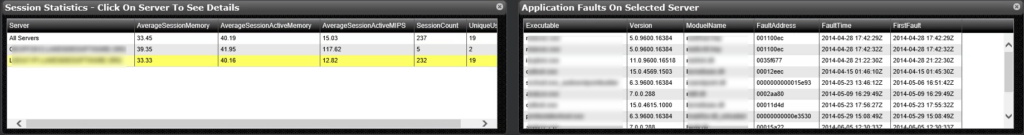
- In the third pane, users can select a specific XenApp server from a list, which also shows average per session resource utilization on each server. Doing so shows all application faults and hangs on that server for the selected time frame along with details about the failure, time stamps, etc.
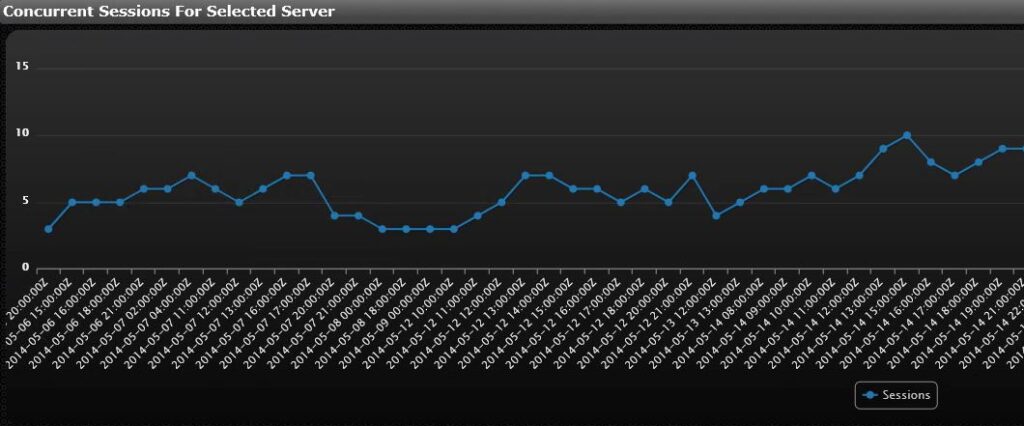
- The line graph right below shows concurrent sessions on the selected server.
- Next, select any user that had a session on the selected server. The list then shows all sessions for that user.
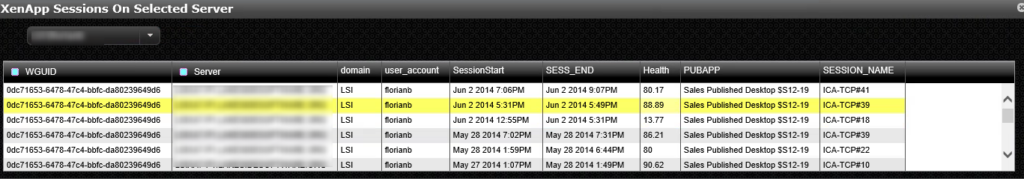
- From here, there are two drill-down capabilities:
(a) Double clicking on the session opens the SysTrack Resolve / Black Box Data Recorder for the Server / User combination and allows administrators and architects to grab the most granular data, views, and visualization that is relevant for the user / server combination.
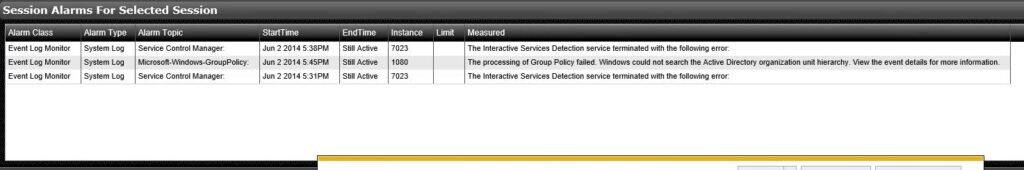
(b) clicking on the session shows all alarms that were recorded on the server during the user’s session.
In summary, this is just one example on how SysTrack can help put all the relevant information for a specific use case into a single view without the need to navigate through multiple visualizers. It also demonstrates the ability to pull in data from multiple data sources (in this case SysTrack and the Desktop Director).
Note: After importing the dashboard into the builder, have a look at the Description on the Dashboard Properties Tab. It has a link to a short document on a few simple configuration steps that are required for this particular dashboard in your SysTrack deployment.
Please share your questions or comments with us.
Florian Becker
Twitter: @florianbecker


Subscribe to Lakeside Updates
Receive product updates, DEX news, and more