With the help of technologies like virtual desktop infrastructure (VDI), SaaS apps, and VPNs, employees have managed to keep business moving while acclimating to remote work. But as the conversation shifts from business continuity to knock-on effects including productivity, what is the long-term impact of the at-home digital experience?
To see where organizations are headed, Lakeside Software recently conducted research into how digital experiences have changed over the past five years.
Specifically, we focused on:
- Productivity (using SysTrack’s quantified end-user experience score)
- Computer monitor setups
- Applications (productivity, video conferencing, and browsers)
- Differences between physical and VDI users
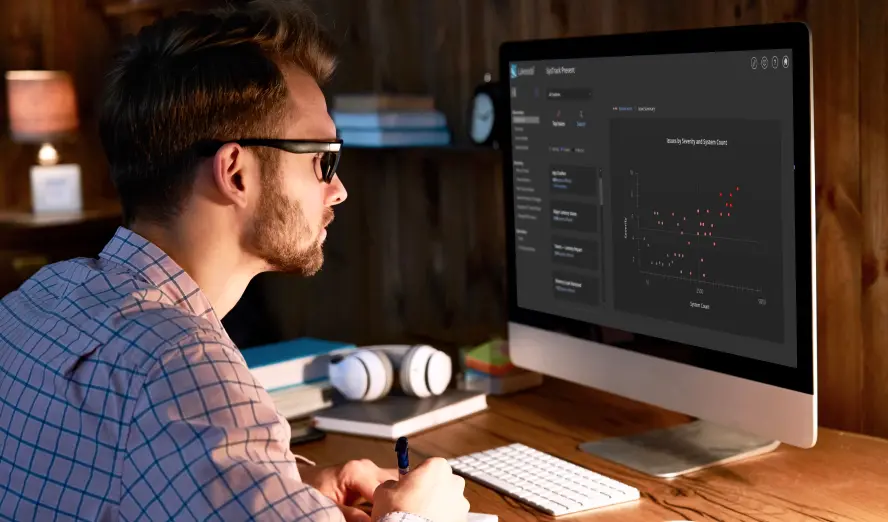
The data we used for our investigation came from SysTrack Community, a rich source of anonymized Lakeside customer data containing information from thousands of systems across industries.
In this post, I’ll cover some of the key findings that emerged from our research, but you can read our full analysis and access additional data by downloading the free white paper below.
Without further ado, here are five trends that show how working from home is shaping the digital employee experience.
1. Poorly Performing Technology Is Inhibiting Employee Productivity
Factors such as home Wi-Fi and personal devices — while necessary for enabling remote work — can make the at-home technology experience worse than what employees used to receive in the office.
In fact, our research found a 5% drop in average end-user experience scores between 2019 and 2020, representing an additional 2 hours per week of negative productivity impact per 40-hour work week.
That’s two more hours of system slowness, application crashes, blue screens, or other events that can disrupt the workday and result in increased help desk tickets.
| Year | Average EUX Score |
|---|---|
| 2016 | 86.46% |
| 2017 | 84.55% |
| 2018 | 84.68% |
| 2019 | 86.53% |
| 2020 | 81.50% |
| Q1 2020 | 82.00% |
| Q2 2020 | 80.06% |
| Q3 2020 | 80.36% |
How do we calculate this? SysTrack end-user experience scoring is a top-level key performance indicator (KPI) built out of lower-level KPIs (application performance, login time, CPU, memory, etc.). To calculate the score, we divide the total time a user is impacted by the total time they are active. By subtracting that number from 100, we are left with the percentage of time that a user was experiencing a nonimpacted session. We group scores into four categories: Excellent is 97% and above, Good is > 90% and < 97%, Fair is > 80% and < 90%, and Poor is everything below that.
Curious what the average end-user experience score would be in your environment? Right now, Lakeside is offering a free trial of SysTrack with additional dashboards designed to make it easy to assess the state of your remote digital experience.
2. Employees Are Demanding Greater Performance from Their Devices
Another trend we identified was an increase in the number of hours each week that users spend with graphically intensive applications. This tells us a few things:
- Devices are running heavier workloads
- Users may be using new applications that are more graphics-intensive
- Established applications (e.g. Microsoft Office) may be demanding more resources as they add new features and updates
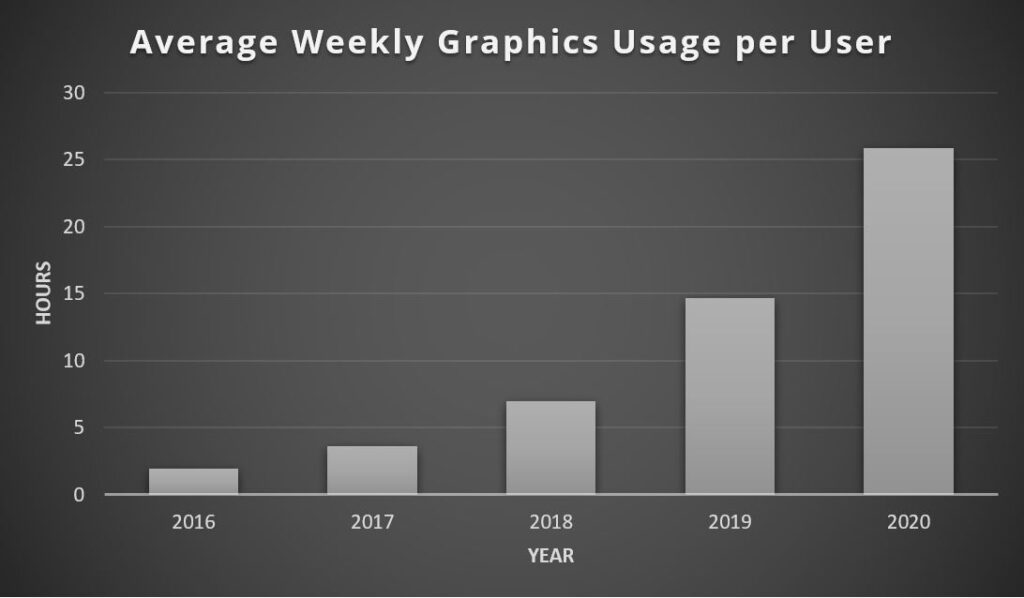
We also compared the amount of time users spend with graphics-intensive applications for physical desktop and virtual desktop users. This distinction is important, as unlike physical desktops which have graphics processors, graphics acceleration for VDI isn’t ubiquitous. Meaning that virtual desktop users are much more likely to notice performance degradation, which can also impact other users sharing the same resources.
While our data from 2016 shows higher graphics consumption with physical desktops, the gap has closed over the years. As of 2020, physical and virtual desktop users are neck-and-neck, with over 60% of their active time spent using graphical applications.
In the past, some organizations have restricted the use of GPU virtualization for edge cases like graphic designers or software engineers. However, it’s clear that graphical needs have shifted significantly overall, so it might be time to evaluate whether providing more VDI users with dedicated GPUs could improve their experience.
3. Increasingly, Employees Are Using More than One Computer Monitor for Work, Although Some Remote Workers Have Downsized
Just as our phones and TV screens have gotten bigger, users’ expectations for monitors have risen as well. While a single monitor per user was the average in 2015, the trend has been towards multi-monitor setups of two or more screens. Of course, this varies by industry, which is why the 2020 average of 1.78 monitors/user is slightly lower than you might expect.
| Year | Average Number of Monitors |
|---|---|
| 2015 | 1.00 |
| 2016 | 1.06 |
| 2017 | 1.24 |
| 2018 | 1.45 |
| 2019 | 1.56 |
| 2020 | 1.78 |
When it comes to industry differences, we noticed a decline in monitor counts between 2019 and 2020 in finance, government, healthcare, and consumer goods. This dip is likely due to the shift to remote work as many users couldn’t transplant their full in-office setup to the home.
Anecdotally, I’ve heard many people speak longingly of the second monitor they abandoned at the office in March, and for good reason. Interestingly, we noticed a correlation between better end-user experience scores and higher monitor counts. While we can only speculate about why the two may be related, it’s worthwhile to investigate whether your users could benefit from additional monitors while they work from home.
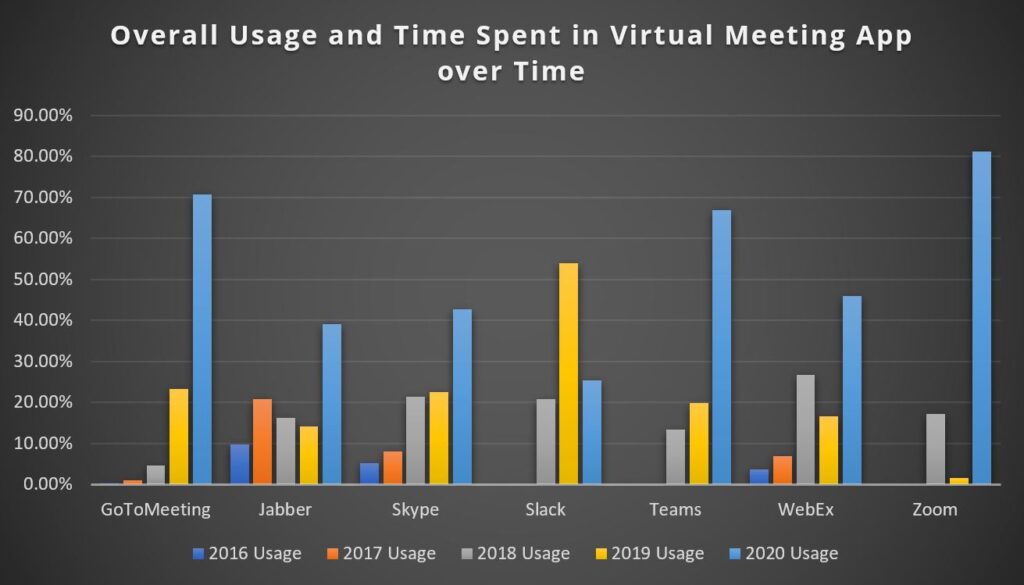
4. Employees Are Spending More Time than Ever in Virtual Meetings
No one will be surprised to hear that 2020 has been the year of video conferencing, but what we wanted to find out was how big the jump was in enterprises where these technologies were already routine.
Overall, we found an increase in chat and meeting software usage between 2019 and 2020, with Zoom, GoToMeeting, and Microsoft Teams leading the pack.
5. Common Applications Including Office 365 and Web Browsers Are Consuming More System Resources
To drill into the second trend we noted regarding increasing graphical requirements, we looked at how different applications have contributed to this uptick. We broke these applications out into three categories: productivity, virtual meeting/chat, and browsers.
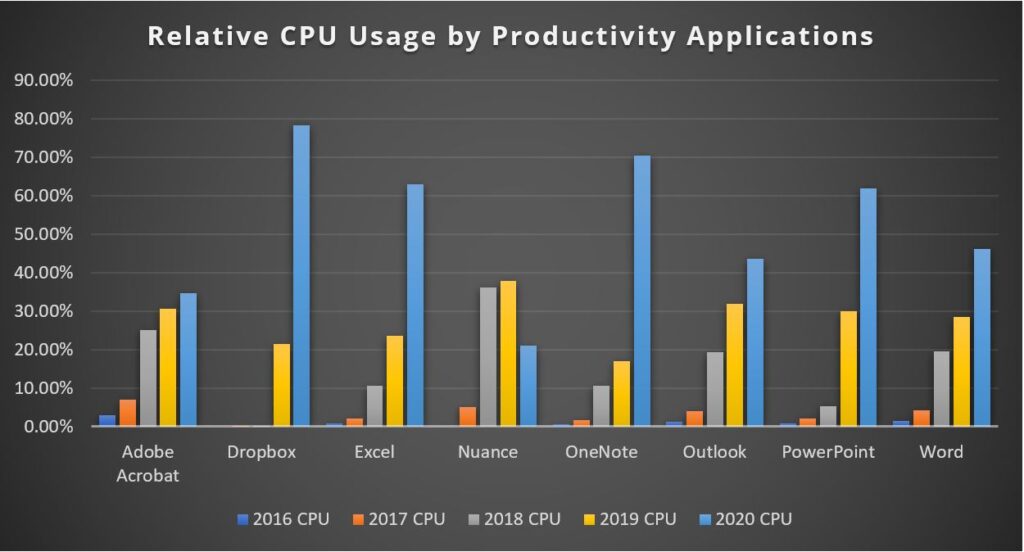
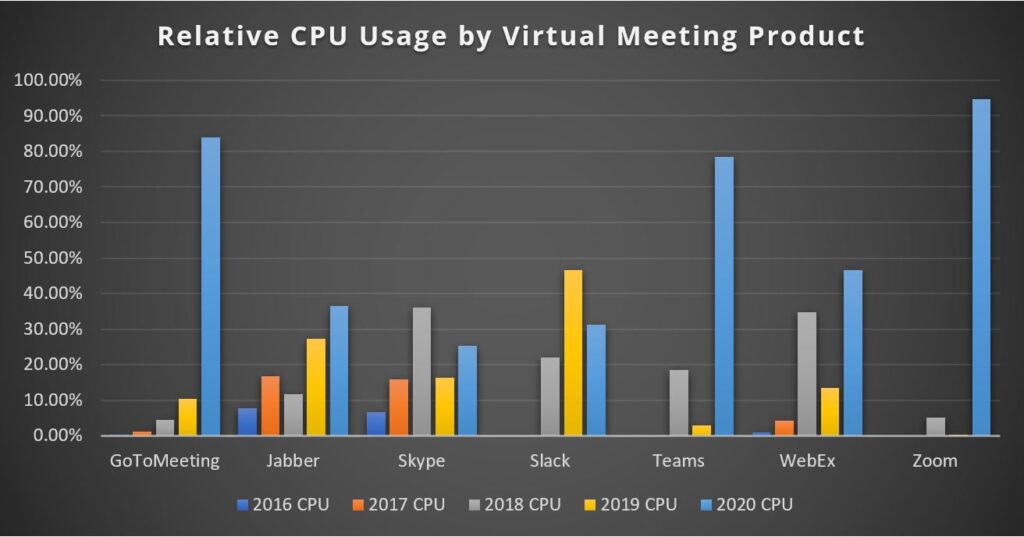
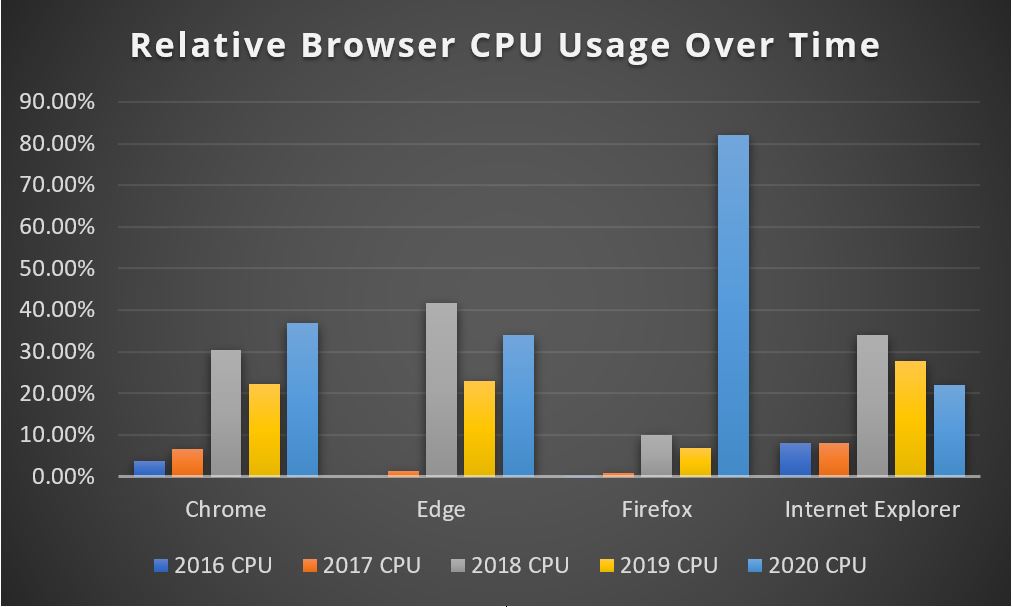
Consistent with our other findings, nearly all of these applications have become more resource-intensive over time as measured by their relative CPU consumption. As applications modernize and add new features, their demands on system resources tend to increase accordingly.
In Summary
In a world where the only time many of us see our colleagues’ faces is on a video call, it’s clear that technology plays a more important role than ever in the workplace.
We hope this research has provided some insight into areas that may require attention for improving remote work at your organization, particularly when it comes to designing VDI to meet the needs of the modern workplace.
To address the increasing graphical demands outlined in this blog, we recommend that organizations assess the needs of their own environment and evaluate the impact GPU acceleration may have.
For more on this topic, watch the on-demand webinar with speakers from NVIDIA, Lakeside Software, and Dell Technologies on “How to Optimize Your Remote Work Setup.”


Subscribe to Lakeside Updates
Receive product updates, DEX news, and more